Murat Sakal
 Research
Syllabus & 14-Week Content Planner
Produces a complete syllabus and detailed 14-week content plan from your course information; includes a learning-outcome-to-week mapping and assessment weights. Who it's for: academics launching a new course or restructuring an existing one.
 Research
Research Topic & Gap Finder
Suggests original, workable research topics and gaps from your area of interest and literature knowledge; provides a research-question draft and feasibility note for each. Who it's for: graduate students and researchers looking for a thesis or article topic.
 Research
Journal Finder & Fit Assessor
Recommends suitable national or international academic journals based on your manuscript topic and preferences (quartile, turnaround, fee); explains scope fit, quartile, and potential risks for each; explicitly flags any predatory-journal suspicion. Who it's for: academics and graduate students preparing a manuscript for submission.
 Research
Syllabus & 14-Week Planner
Based on your course information, creates a complete syllabus and detailed 14-week content plan, including learning outcome-to-week mapping and assessment weights. Best for: academics launching a new course or structuring an existing one.
 Research
Research Topic & Gap Finder
Suggests original, feasible research topics and gaps based on your interests and knowledge of the existing literature. For each, it provides a draft research question and a feasibility note. Who it's for: Graduate students and researchers looking for a thesis or paper topic.
 Research
Journal Finder & Evaluator
Recommends suitable academic journals based on your paper’s topic and preferences (national/international scope, Q quartile, turnaround time, and fees); explains each journal’s scope fit, quartile, and potential risks; and clearly warns you if a journal may be predatory. Who it’s for: academics and graduate students preparing their papers for publication.
 Research
Qualitative Rigor & COREQ Auditor
Writes a Methods section based on Lincoln & Guba's trustworthiness criteria from your qualitative study design; then reveals which COREQ checklist items are missing or weakly reported, without concealment. Who it's for: researchers seeking reporting robustness before journal submission and graduate students writing a thesis.
 Research
Thematic Analysis & Codebook Builder
Builds a systematic codebook and theme map from your raw data excerpts or initial open codes; suggests a parent-child structure for use in MAXQDA/NVivo. Supports inductive, deductive, or hybrid analytic approaches. Who it's for: researchers conducting thematic analysis or content analysis.
 Research
Interview & Focus Group Protocol Writer
Prepares a complete semi-structured interview guide or focus group protocol, from warm-up questions to closing, based on your research question and participant profile. Produces non-leading, open-ended questions and suggests an a priori code list for MAXQDA/NVivo. Who it's for: researchers and graduate students conducting qualitative or mixed-methods research.
 Research
Qualitative Rigor & COREQ
Based on your qualitative study design, it writes a Methods section according to the Lincoln & Guba trustworthiness criteria, then transparently identifies which items are missing or weakly reported according to the COREQ checklist. Who it’s for: researchers seeking robust reporting before journal submission and graduate students writing theses.
 Research
Thematic Analysis & Codebook
Creates a systematic codebook and thematic map from your raw data excerpts or initial open codes, recommending codes in a parent-child structure for use in MAXQDA/NVivo. Supports inductive, deductive, or hybrid analysis approaches. Who it's for: researchers conducting thematic or content analysis.
 Research
Interview & Focus Group Guide
Creates a complete semi-structured interview guide or focus group protocol—from warm-up questions through closing—based on your research question and participant profile. Generates non-leading, open-ended questions and suggests a preliminary code list for use in MAXQDA/NVivo. For: academics and graduate students conducting qualitative or mixed-methods research.
 Research
STROBE/CONSORT Methods-Results Writer
Produces a complete Methods + Results section following the reporting standard that fits your study design (STROBE for observational studies, CONSORT for randomized controlled trials); then audits which checklist items are missing or weakly reported without concealment, and suggests how to complete them. Who it's for: researchers seeking reporting robustness before journal submission and graduate students writing a thesis.
 Research
Kaplan-Meier Survival Analysis Writer
Produces a complete Methods + Results text from your Kaplan-Meier survival curve, log-rank test, and Cox regression output. Correctly interprets hazard ratios, explicitly flags a high censoring rate, and reminds you to check the proportional hazards assumption for Cox models. Who it's for: researchers working with clinical/epidemiological survival data.
 Research
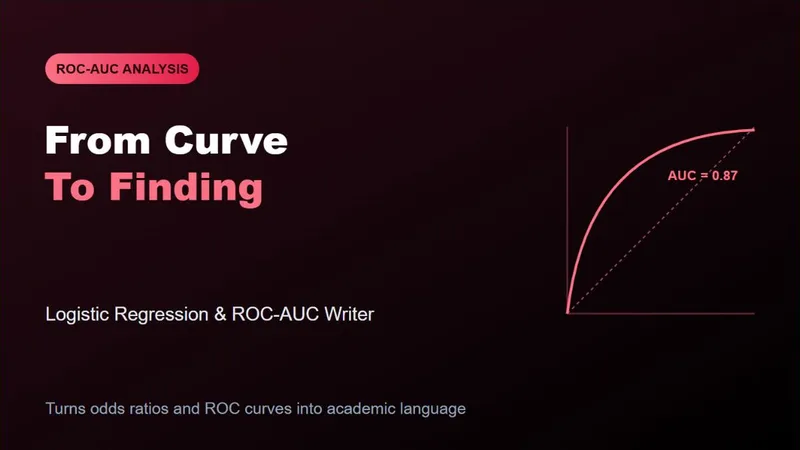
Logistic Regression & ROC-AUC Writer
Turns your logistic regression analysis output (odds ratio, confidence interval, ROC-AUC) into an academic Results section ready for direct inclusion in a manuscript. Correctly classifies the ROC-AUC value against standard benchmarks and never overstates non-significant variables. Who it's for: researchers building clinical prediction models and graduate students.
 Research
STROBE/CONSORT Section Writer
Produces complete Methods + Results sections according to the reporting standard appropriate for your study design (STROBE for observational studies and CONSORT for randomized controlled trials). It then transparently audits which checklist items are missing or weakly reported and provides suggestions for completing them. Suitable for researchers seeking robust reporting before journal submission and graduate students writing a thesis.
 Research
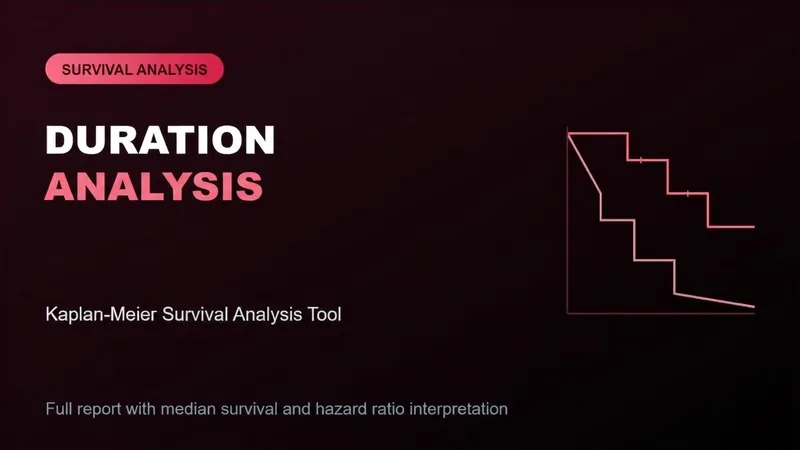
Kaplan-Meier Report Writer
Generates a complete Methods + Results section from your Kaplan-Meier survival curves, log-rank tests, and Cox regression outputs. Correctly interprets hazard ratios, clearly notes when the censoring rate is high, and reminds you to check the proportional hazards assumption for the Cox model. Suitable for researchers working with clinical or epidemiological survival data.
 Research
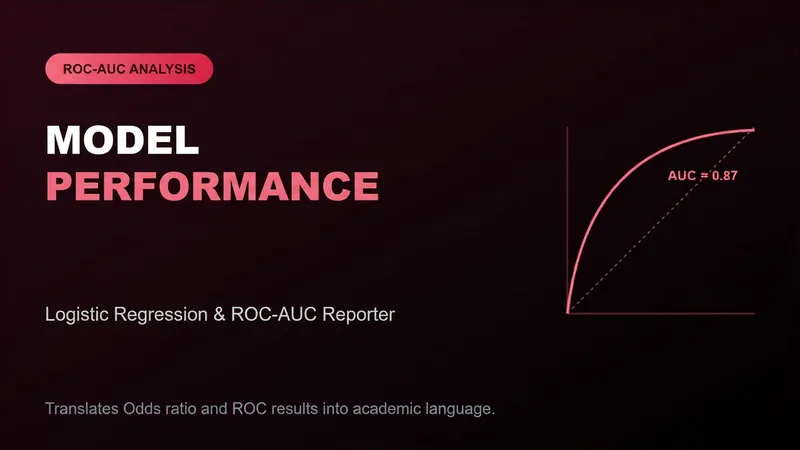
Logistic Regression ROC-AUC
Turns your logistic regression analysis outputs (odds ratios, confidence intervals, and ROC-AUC) into an academic Findings section that can be added directly to a paper. Correctly classifies the ROC-AUC value according to standard benchmarks and avoids overstating results for non-significant variables. Suitable for researchers building clinical prediction models and graduate students.
 Research
Full .mbz Package Generation Engine
Produces the XML skeleton structure and section-to-activity mapping needed for a Moodle-restorable .mbz course backup from your full weekly curriculum content (topic, resource, assignment, quiz); provides a post-installation validation checklist. Who it's for: instructors who want to bulk-package multi-week courses.
 Research
Adaptive Quiz Logic Designer
Produces a written specification for conditional access and adaptive quiz logic (unlocking modules by score range, branching) that can be set up in Moodle from your quiz purpose and question pool, along with implementation steps for the Moodle interface. Who it's for: education technologists designing personalized learning paths.
 Research
Moodle Course Skeleton Planner
Produces a structured course section/topic skeleton from your multi-week syllabus summary that can be manually built in Moodle; lists suggested activity modules (Assignment, Quiz, Forum, Resource) and an assessment weight distribution for each week. Who it's for: instructors setting up a new Moodle course and education coordinators.
 Research
SCORM Content Structuring + Alignment
Designs the content skeleton (screens, interaction points, assessment items) of a SCORM-compliant e-learning package from your module topic and learning outcomes; then audits which screen addresses each learning outcome and how it's measured, explicitly reporting any misaligned outcome and suggesting content to close the gap. Who it's for: e-learning content developers and distance education coordinators.
 Research
Analytic Rubric Designer
Produces a complete analytic rubric from your assignment or project description, structured as a performance-level × assessment-criteria matrix with concrete, observable descriptions. Automatically balances point weightings against the total score. Who it's for: instructors and teaching assistants grading assignments or projects.
 Research
Learning Outcome–Bloom Mapper
Classifies your learning outcomes by Bloom's taxonomy level, corrects unmeasurable verbs (like "know" or "understand"), and suggests an appropriate assessment method for each outcome. Classifies based on the outcome's actual cognitive demand, not the surface meaning of the verb. Who it's for: instructors doing curriculum/course design and program development committees.
 Research
Multi-Type GIFT Bank + Bloom Audit
Produces a complete GIFT-format question bank from your topic and learning outcomes, including multiple choice, true/false, matching, short answer, and fill-in-the-blank question types. Tags each question's Bloom taxonomy level, and if questions are heavily concentrated at lower levels (Remember/Understand), explicitly reports it and suggests additional questions targeting higher-order thinking skills. Who it's for: assessment coordinators and department heads wanting to audit exam pool quality.
 Research
Weekly Lesson Plan Writer
Produces a structured weekly lesson plan from your lesson topic and duration, including measurable learning objectives written with Bloom's taxonomy verbs, a time-scheduled lesson flow, and a suggested assessment element. Always matches objectives to activities. Who it's for: university instructors and educators preparing courses or training programs.
 Research
GIFT Format Question Bank Writer
Produces a GIFT-format multiple-choice question bank from your topic and content, ready to upload directly to Moodle's "Question bank > Import" screen. Marks the correct option, generates plausible topic-relevant distractors, and leaves no room for GIFT syntax errors. Who it's for: instructors teaching on Moodle and education coordinators preparing exam pools.
 Research
Complete .mbz Course Engine
From your complete weekly course content (topics, resources, assignments, and exams), this Skill generates the XML skeleton structure and section-activity mapping needed for an .mbz course backup that can be restored directly to Moodle. It also provides a post-installation verification checklist. Suitable for instructors who want to package multi-week courses in bulk (see the user's own BSM Current Topics project model).
 Research
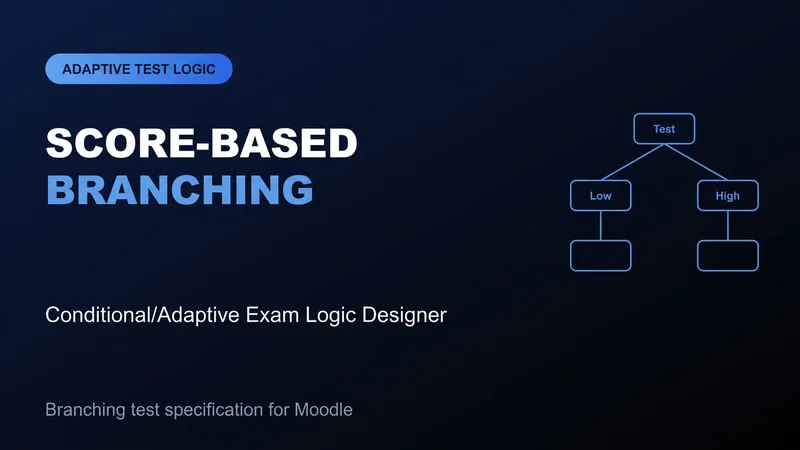
Adaptive Exam Logic Designer
Generates a written specification for conditional access and adaptive exam logic that can be built in Moodle—such as opening modules based on score ranges and branching—along with step-by-step instructions for implementing it in the Moodle interface. Suitable for: educational technologists designing personalized learning pathways.
 Research
Moodle Course Outline Planner
Creates a structured course section/topic outline from your multi-week curriculum summary that can be set up manually in Moodle; for each week, it lists recommended activity modules (Assignment, Quiz, Forum, Resource) and an assessment weighting distribution. Who it's for: Instructors and education coordinators setting up new courses in Moodle.
 Research
SCORM Content & Alignment
Designs the content framework for a SCORM-compliant e-learning package (screens, interaction points, and assessment items) based on your module topic and learning outcomes; then checks which screen covers each learning outcome and how it is measured, clearly reports any misaligned outcomes, and suggests content to address the gaps. Suitable for e-learning content developers and distance learning coordinators.
 Research
Analytical Rubric Designer
Generates a complete analytical rubric from your assignment or project description, with concrete and observable explanations in a performance levels × assessment criteria matrix. Automatically balances score weights according to the total score. Suitable for: instructors and teaching assistants who assess assignments or projects.
 Research
Learning Outcome–Bloom Matcher
Classifies your learning outcomes according to Bloom’s taxonomy levels, corrects unmeasurable verbs such as “knows” and “understands,” and suggests an appropriate assessment method for each outcome. It classifies outcomes based on their actual cognitive demand, not the surface meaning of the verb. Suitable for: instructors who design curricula or courses and curriculum development committees.
 Research
GIFT Bank + Bloom Audit
Generate a complete question bank in GIFT format from your topics and learning outcomes, including multiple-choice, true/false, matching, short-answer, and fill-in-the-blank questions. Each question is labeled with its level in Bloom’s taxonomy. If the questions are concentrated primarily at lower levels (Remember/Understand), this is clearly reported, along with suggestions for additional questions that assess higher-order thinking skills. Suitable for assessment and evaluation professionals and department coordinators who want to review the quality of their exam question pools.
 Research
Weekly Lesson Plan Writer
Creates a structured weekly lesson plan from the lesson topic and duration you provide. It includes measurable learning objectives written with Bloom’s taxonomy verbs, a timed lesson flow, and a suggested assessment component. Learning objectives and activities are always aligned with each other. Suitable for university instructors and educators developing courses or training programs.
 Research
GIFT Question Bank Writer
Generate a multiple-choice question bank in GIFT format from the topic and content you provide, ready to upload directly to Moodle’s "Question bank > Import" screen. The tool marks the correct answer, creates plausible distractors related to the topic, and avoids GIFT syntax errors. Suitable for instructors teaching on Moodle and education coordinators preparing exam question banks.
 Research
Statistical Report + Reviewer Objection
Produces a complete Results section from your descriptive + inferential statistics outputs (including assumption tests). If it detects a normality or variance homogeneity violation, it recommends the non-parametric alternative test rather than concealing it. It also pre-identifies at least 4 objections journal reviewers commonly raise (e.g., "assumption tests not reported", "effect size not stated", "no multiple comparison correction applied") and provides a defense sentence for each. Who it's for: researchers working with quantitative methods who want statistical reporting rigor before journal submission.
 Research
Group Comparison Test Writer
Produces an APA 7-compliant, manuscript-ready Results text from your t-test, ANOVA, or Chi-square test outputs. Uses correct statistical reporting format (t(df)=..., p=..., d=...) and interprets effect size against Cohen's benchmarks. Reminds you to state a multiple comparison correction method when three or more groups are compared. Who it's for: researchers and graduate students running experimental or comparative studies.
 Research
Descriptive Statistics Writer
Converts the user's descriptive statistics outputs (mean±SD or median(IQR), n(%)) into an academic "Participant Characteristics" paragraph ready to drop into a manuscript, plus a Table 1 formatted table. Selects the correct descriptive statistic (mean±SD vs. median(IQR)) based on normality status and never mixes the two up. Who it's for: graduate students and academics running quantitative research who want to write the manuscript's "Participants" section quickly and correctly.
 Research
Stats Report + Reviewer Reply
Generates a complete Findings section from your descriptive and inferential statistics outputs, including assumption tests. If it detects violations of normality or homogeneity of variance, it recommends a nonparametric alternative test rather than hiding the issue. It also anticipates at least four objections commonly raised by journal reviewers (for example, "assumption tests were not reported," "effect sizes were not provided," or "no multiple-comparison correction was applied") and provides a defense sentence for each. Suitable for: researchers working with quantitative research methods who want stronger statistical reporting before journal submission.
 Research
Group Comparison Test Writer
Generates APA 7-compliant, publication-ready Results text from your t-test, ANOVA, or chi-square test outputs. Uses the correct statistical reporting format (t(df) = ..., p = ..., d = ...) and interprets effect sizes according to Cohen’s criteria. Reminds you to report a multiple-comparison correction when comparing three or more groups. Suitable for researchers and graduate students conducting experimental or comparative studies.
 Research
Descriptive Statistics Writer
Converts the user's descriptive statistics outputs (mean±SD or median(IQR), n(%)) into an academic "Participant Characteristics" paragraph that can be added directly to a paper, as well as a table in Table 1 format. Selects the correct descriptive statistic (mean±SD vs median(IQR)) based on normality and never mixes them up. Suitable for: graduate students and academics conducting quantitative research who want to write the "Participants" section of their paper quickly and accurately.
 Research
Entropy-TOPSIS-ML + Reviewer Objection
Produces a complete Methods + Results report from your entropy weighting + TOPSIS ranking + ML classifier (XGBoost, Random Forest, Logistic Regression, etc.) outputs. Correctly classifies AUC interpretation (Hosmer & Lemeshow criteria) and, if the train/test performance gap is large, states the overfitting risk explicitly. It also pre-identifies at least 4 objections journal reviewers frequently raise (e.g., "how was class imbalance handled," "no external validation set was used") and suggests a defense sentence for each. Suitable for: researchers working in health informatics, clinical risk prediction, or hybrid MCDM-ML methodology who want methodological robustness before journal submission.
 Research
TOPSIS Decision Analysis Writer
Produces a complete manuscript-ready Methods + Results text from your TOPSIS analysis outputs (normalized decision matrix, distances to positive/negative ideal solutions, closeness coefficients). Provides a ranking table and interprets which criteria the best and worst alternatives excelled or lagged in. Suitable for: researchers working on multi-criteria ranking problems such as supplier selection, product/service comparison, or clinical decision support.
 Research
AHP Criteria Weighting Writer
Converts the user's AHP (Analytic Hierarchy Process) pairwise comparison matrix outputs (criteria weights, consistency ratio) into an academic "Criteria Weighting" section ready to drop straight into a manuscript. If the consistency ratio (CR) exceeds 0.10, it states this openly rather than hiding it. Suitable for: researchers who use MCDM methods such as TOPSIS/VIKOR and determine criteria weights with AHP, and graduate students.
 Research
Entropy-TOPSIS-ML + Rebuttal
Generates a complete Methods + Results report from your entropy weighting, TOPSIS ranking, and ML classifier outputs (XGBoost, Random Forest, Logistic Regression, etc.). Correctly interprets AUC using the Hosmer & Lemeshow criteria and clearly flags the risk of overfitting when the training and test performance gap is large. It also anticipates at least four objections frequently raised by journal reviewers (e.g., “How was class imbalance addressed?” and “Why was no external validation set used?”) and provides a defense statement for each. Suitable for researchers working in health informatics, clinical risk prediction, or hybrid MCDA-ML methodologies, as well as those seeking methodological rigor before journal submission.
 Research
TOPSIS Decision Report Writer
Produces a complete, article-ready Methods + Results text from your TOPSIS analysis outputs (normalized decision matrix, positive/negative ideal solution distances, and closeness coefficients). Presents a ranking table and interprets which criteria distinguish the best and worst alternatives. Suitable for researchers working on multi-criteria ranking problems such as supplier selection, product/service comparison, and clinical decision support.
 Research
AHP Criterion Weighting Writer
Transforms the user's AHP (Analytic Hierarchy Process) pairwise comparison matrix outputs—criterion weights and consistency ratio—into an academic "Criterion Weighting" section that can be directly added to a paper. If the consistency ratio (CR) exceeds 0.10, it states this clearly without hiding it. Suitable for researchers and graduate students who use MCDM methods such as TOPSIS and VIKOR and determine criterion weights with AHP.
 Research
PLS-SEM Report + Objection Engine
Produces a complete Measurement Model + Structural Model report from your PLS-SEM analysis outputs (outer loadings, CR/AVE, HTMT discriminant validity, path coefficients, R²/f²/Q², SRMR). Correctly applies the HTMT threshold and R² interpretation (Cohen/Chin criteria) and avoids causal language. It also pre-identifies at least 4 objections journal reviewers frequently raise (e.g., "why PLS over CB-SEM," "no CMB control reported") and suggests a defense sentence for each. Suitable for: business/social science researchers using PLS-SEM for structural equation modeling who want methodological robustness before journal submission.
 Research
Validity-Reliability Report Writer
Produces a complete manuscript-ready Methods + Results text from your EFA or CFA analysis outputs (KMO, Bartlett's test, factor loadings, fit indices, Cronbach alpha/CR/AVE). Correctly classifies fit index thresholds (CFI/TLI≥.90, RMSEA≤.08, etc.) and reports validity issues like AVE<0.50 without hiding them. Suitable for: academics and graduate students conducting scale development or adaptation studies.
 Research
Cronbach Alpha Reliability Writer
Converts the reliability statistics you enter (Cronbach alpha, item count, subscales) into an academic "Reliability Analysis" paragraph ready to drop straight into your manuscript. Provides an acceptability table by subscale and, if it detects a low alpha (<.60), states this openly rather than hiding it. Suitable for: graduate students and researchers using scales who want to write the method section quickly and correctly.
 Research
PLS-SEM Report & Rebuttal
Generates a complete Measurement Model + Structural Model report from your PLS-SEM analysis outputs (outer loadings, CR/AVE, HTMT discriminant validity, path coefficients, R²/f²/Q², SRMR). Applies the correct HTMT threshold and R² interpretation (Cohen/Chin criteria) and avoids causal language. It also anticipates at least 4 common journal reviewer objections (e.g., “Why was PLS chosen instead of CB-SEM?” and “CMB was not tested”) and provides a defense statement for each. Suitable for business and social science researchers conducting structural equation modeling with PLS-SEM, and for those seeking methodological rigor before submitting to a journal.
 Research
Validity & Reliability Writer
Generates a complete, publication-ready Methods + Results section from your EFA or CFA analysis outputs, including KMO, Bartlett’s test, factor loadings, fit indices, and Cronbach’s alpha/CR/AVE. Correctly classifies fit index thresholds (CFI/TLI ≥ .90, RMSEA ≤ .08, etc.) and reports validity concerns such as AVE < .50 without hiding them. Suitable for academics and graduate students conducting scale development or adaptation studies.
 Research
Cronbach Alpha Writer
Converts the reliability statistics entered by the user (Cronbach's alpha, item count, and subdimensions) into an academic “Reliability Analysis” paragraph ready to add directly to a paper. Provides an acceptability table by subdimension and clearly reports low alpha values (<.60) without hiding them. Best for: graduate students and researchers using scales who want to write the methods section of a thesis or paper quickly and accurately.
 Research
CONSORT 2010 Report Writer
From your randomized controlled trial (RCT) data — randomization method, blinding status, power analysis, CONSORT flow numbers (screened/randomized/allocated/analyzed), ITT/PP analysis approach — it produces a complete Abstract + Methods + Results draft compliant with all 25 items of CONSORT 2010. It never confuses ITT/PP; it checks the consistency of flow diagram numbers (randomized ≥ allocated ≥ followed-up ≥ analyzed). It also pre-identifies at least 4 objections journal reviewers frequently raise (e.g., "why wasn't an ITT analysis reported," "was blinding success tested," "was there outcome switching") and suggests a defense sentence for each. Designed for clinical researchers in medicine/nursing/pharmacy conducting RCTs who want methodological robustness before journal submission. What it does not do: it does not perform statistical analysis or generate data — it only converts results you already have into a CONSORT-standard report.
 Research
STROBE Methods Writer
Based on your cross-sectional, cohort, or case-control study design; when you enter your participant selection method, variables, sample size rationale, and statistical methods, it produces a complete Methods and Results draft with implicit reference to all 22 items of the STROBE (Strengthening the Reporting of Observational Studies in Epidemiology) checklist. It also provides a mapping table at the end showing which paragraph corresponds to which STROBE item — ready to answer a journal's "please complete the STROBE checklist" request. Avoids causal language (uses "is associated with" rather than "causes" for observational studies) and explicitly discusses sources of bias/confounding. Suitable for academics working in epidemiology, public health, and clinical research.
 Research
Missing Data Reporting Assistant
When you enter your sample size, missing data proportion/pattern (MCAR/MAR/MNAR), missing data method (listwise deletion, multiple imputation, etc.), and outlier detection method (Z-score, IQR, Mahalanobis), it produces an academic paragraph that can be inserted directly into the "Data Pre-processing" section of your manuscript. If there is a methodological contradiction between your method choice and the missing data pattern (e.g., using listwise deletion under an MNAR pattern), it states this explicitly. Suitable for: graduate students and researchers doing survey/clinical data analysis who want to write the data pre-processing section quickly and correctly.
Scale Development Data Audit
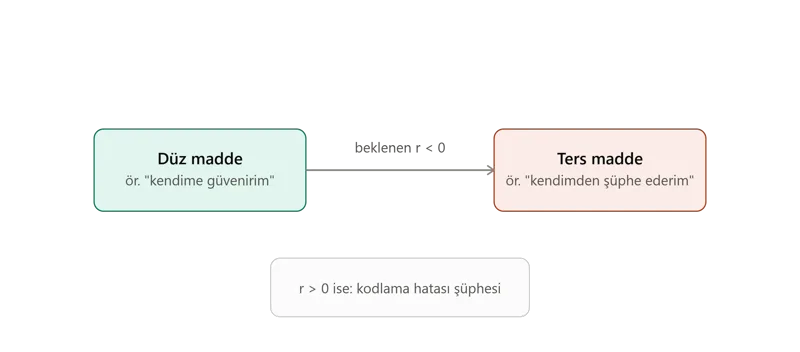
This skill systematically audits raw survey data collected as part of a scale development study for missing data, outliers, careless responding (straightlining, longstring, random responding), item-level distribution problems, and the prerequisites for reliability and factorability. It does not produce final EFA/CFA results; instead, it provides an evidence-based “go/no-go” decision on whether the data are ready for subsequent analyses, along with a recommendation for a stratified sample split (EFA/CFA split). All calculations are performed by running real code (Python: pandas, scipy, factor_analyzer, pingouin); no assumed numbers are generated.
 Research
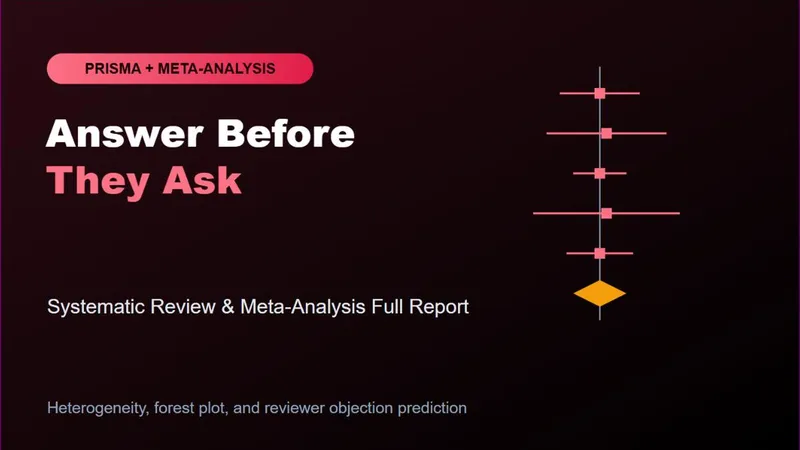
Meta-Analysis Full Report Writer
Produces a complete Methods + Results + Limitations text compliant with PRISMA 2020 and the Cochrane Handbook from your meta-analysis statistics (pooled effect size, I², Q, tau², publication bias indicators). Never misinterprets the I² value (including the "percentage of variance" framing); avoids overstated causal language (uses cautious phrasing like "findings are consistent with..." instead of "evidence demonstrates that"). At the end, it also offers at least 3 questions a reviewer might ask along with defense sentences. Suitable for: researchers writing a meta-analysis paper who want to strengthen the methods section before journal submission. What it does not do: it does not perform statistical calculations from raw data (you must already have your R/RevMan/CMA output) — it only converts and interprets your results into academic text.
 Research
Bibliometric Findings Writer
Converts the raw numbers you obtain from VOSviewer or Biblioshiny (Bibliometrix/R) outputs (keyword frequencies, citation network clusters, yearly publication trend, country/institution/journal distribution) into publication-ready, interpreted academic text. Uses an academic tone that narrates where the literature is heading rather than repeating raw numbers; avoids speculative causal claims. Suitable for: researchers writing a thesis/paper who need a bibliometric analysis section but struggle to translate raw data into academic language. Usage: paste your cluster/keyword list from VOSviewer or your Biblioshiny summary table directly; the skill thematically names and interprets the keyword clusters, and evaluates the citation network and country collaboration pattern.
 Research
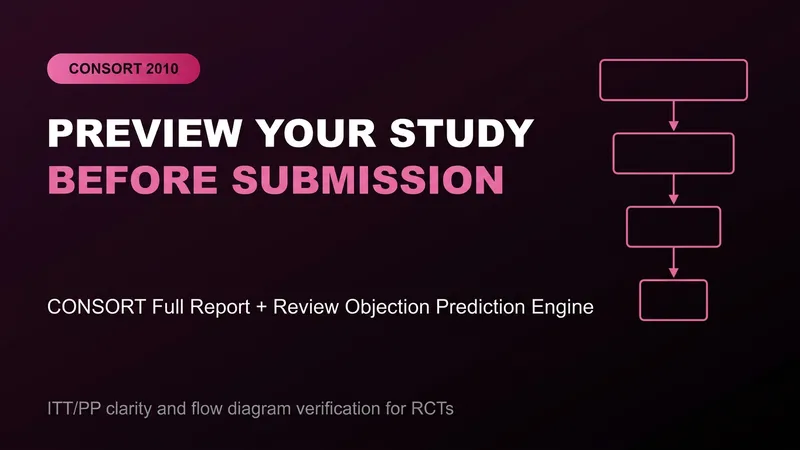
PRISMA 2020 Flow Diagram Writer
Generates a PRISMA 2020-compliant flow diagram text and protocol paragraph for researchers conducting systematic reviews. When you enter your database screening counts (identification → screening → eligibility → included), it checks the consistency of the numbers and produces text defensible against the reviewer question "why does your flow diagram lose so many records?" It also converts your inclusion/exclusion criteria into a PICO/PECO-format table. Suitable for: graduate students, academics, and journal editors' pre-checks for systematic review/meta-analysis papers. If it detects a numeric inconsistency (e.g., included > eligibility) it states this explicitly rather than silently correcting it.
 Research
CONSORT 2010 Full Report Writer
Generates a complete Abstract + Methods + Results draft from your randomized controlled trial (RCT) data—randomization method, blinding status, power analysis, CONSORT flow counts (screened/randomized/allocated/analyzed), and ITT/PP analysis approach—in accordance with CONSORT 2010’s 25-item checklist. It never confuses ITT and PP; it checks the consistency of flow diagram counts (randomized ≥ allocated ≥ followed-up ≥ analyzed). It also proactively identifies at least 4 objections frequently raised by journal reviewers (such as “Why was an ITT analysis not reported?”, “Was the success of blinding tested?”, and “Was there any outcome switching?”) and suggests a defense sentence for each. Designed for clinical researchers and academics conducting RCTs in medicine, nursing, or pharmacy who want methodological rigor before journal submission.
 Research
STROBE Checklist Method Writer
Based on your cross-sectional, cohort, or case-control study design, this Skill generates a complete Methods and Results draft when you provide your participant selection method, variables, sample size rationale, and statistical methods, with implicit reference to the 22 items of the STROBE (Strengthening the Reporting of Observational Studies in Epidemiology) checklist. It also provides a mapping table showing which paragraph addresses each STROBE item—helping you respond to a journal's request to "complete the STROBE checklist" during submission. It avoids causal language, using "is associated with" rather than "causes" for observational studies, and explicitly discusses sources of bias and confounding. It is suitable for academics working in epidemiology, public health, and clinical research.
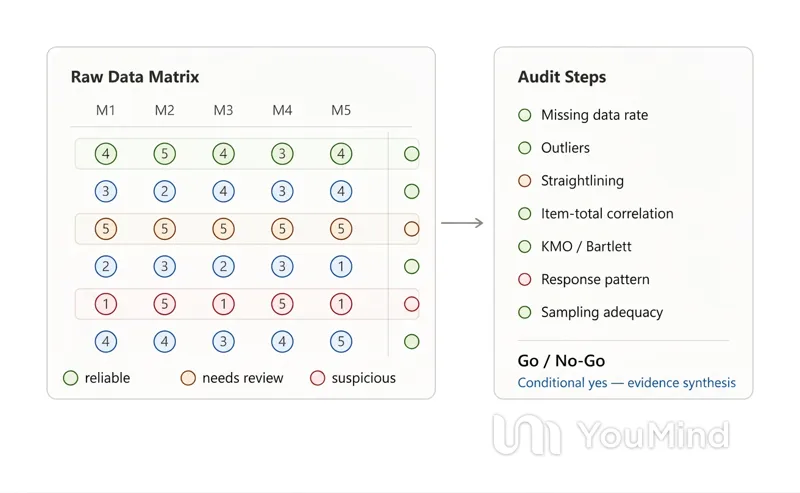
Scale Data Precheck
Triggered when raw scale development data (Excel/CSV) collected by a professional survey firm needs to be reviewed for psychometric data quality before proceeding to EFA/CFA or final reliability analyses. It comprehensively evaluates missing data, outliers, careless responding, response bias, item quality, and sample adequacy, then produces a Go/No-Go decision. It does not modify the data; it only provides a diagnostic audit report.
 Research
Missing Data & Outliers
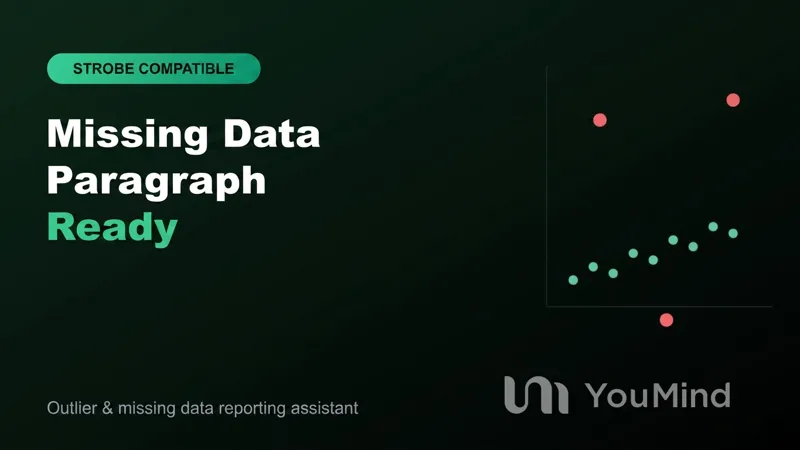
Enter your sample size, missing data rate and pattern (MCAR/MAR/MNAR), the missing data method you used (such as listwise deletion or multiple imputation), and your outlier detection method (Z-score, IQR, or Mahalanobis) to generate an academic paragraph that can be added directly to the “Data Preprocessing” section of your paper. If there is a methodological inconsistency between your chosen method and the missing data pattern—for example, using listwise deletion with an MNAR pattern—it will be clearly identified. Suitable for graduate students and researchers conducting survey or clinical data analysis who want to write their data preprocessing section quickly and accurately.
 Research
Meta-Analysis Report
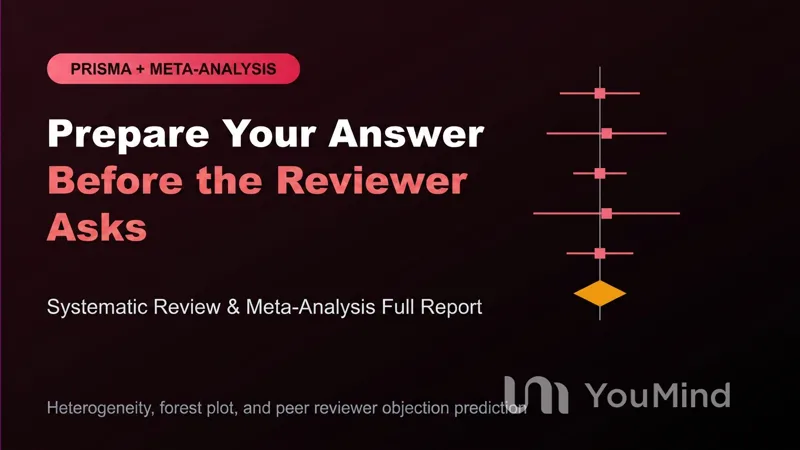
Produces a complete Methods + Results + Limitations text from your meta-analysis statistics (pooled effect size, I², Q, tau², and publication bias indicators), in line with PRISMA 2020 and the Cochrane Handbook. It never misinterprets I² values (including the percentage of variance explained) and avoids overstated causal language, using cautious wording such as “the findings are consistent with...” instead of “the evidence shows that...”. It also provides at least three potential reviewer questions and response statements that can help address them. Suitable for researchers writing a meta-analysis paper who want to strengthen their Methods section before journal submission. What it does not do: it does not calculate statistics from raw data (you must already have calculated your R/RevMan/CMA output); it only converts and interprets the results as academic text.

Bibliometric Findings Writer
Transforms the raw numbers from VOSviewer or Biblioshiny (Bibliometrix/R)—including keyword frequencies, citation network clusters, annual publication trends, and country/institution/journal distributions—into interpreted text ready for academic publication. Rather than repeating the numbers, it uses an academic tone to explain how the literature is evolving and avoids speculative causal claims. Suitable for researchers writing theses or articles who need to prepare a bibliometric analysis section but struggle to translate raw data into academic language. Usage: Paste the cluster/keyword list from VOSviewer or the Biblioshiny summary table directly; the skill names and interprets keyword clusters thematically, and evaluates citation networks and country collaboration patterns.
 Research
PRISMA 2020 Flowchart Writer
For researchers conducting systematic reviews, this Skill generates flowchart text and a protocol paragraph that follow the PRISMA 2020 checklist. When you enter your database screening counts (identification → screening → eligibility → included), it checks the numbers for consistency and produces defensible text addressing a reviewer's question: "Why does your flowchart show so many losses?" It also converts your inclusion and exclusion criteria into a table in PICO/PECO format. This Skill is suitable for graduate students writing systematic reviews or meta-analyses, as well as journal editors conducting pre-publication checks. If it detects a numerical inconsistency (for example, included > eligibility), it states this clearly rather than silently correcting it.