Bibliometric Findings Writer
Turns your VOSviewer/Bibliometrix output into academic text
Bibliometric Findings Writer
Turns your VOSviewer/Bibliometrix output into academic text
Showcase
Description
Converts the raw numbers you obtain from VOSviewer or Biblioshiny (Bibliometrix/R) outputs (keyword frequencies, citation network clusters, yearly publication trend, country/institution/journal distribution) into publication-ready, interpreted academic text. Uses an academic tone that narrates where the literature is heading rather than repeating raw numbers; avoids speculative causal claims. Suitable for: researchers writing a thesis/paper who need a bibliometric analysis section but struggle to translate raw data into academic language. Usage: paste your cluster/keyword list from VOSviewer or your Biblioshiny summary table directly; the skill thematically names and interprets the keyword clusters, and evaluates the citation network and country collaboration pattern.
Recommended by
Shuting@YouMind
Why we love this skill
An editor’s pick for turning raw VOSviewer or Bibliometrix outputs into publication-ready findings. It stands out by interpreting trends, thematic clusters, influence networks, and collaboration patterns with disciplined academic caution, while integrating replaceable table and figure references.
Related Skills
View all Research
Meta-Analysis Full Report Writer
Produces a complete Methods + Results + Limitations text compliant with PRISMA 2020 and the Cochrane Handbook from your meta-analysis statistics (pooled effect size, I², Q, tau², publication bias indicators). Never misinterprets the I² value (including the "percentage of variance" framing); avoids overstated causal language (uses cautious phrasing like "findings are consistent with..." instead of "evidence demonstrates that"). At the end, it also offers at least 3 questions a reviewer might ask along with defense sentences. Suitable for: researchers writing a meta-analysis paper who want to strengthen the methods section before journal submission. What it does not do: it does not perform statistical calculations from raw data (you must already have your R/RevMan/CMA output) — it only converts and interprets your results into academic text.
 Research
Cronbach Alpha Reliability Writer
Converts the reliability statistics you enter (Cronbach alpha, item count, subscales) into an academic "Reliability Analysis" paragraph ready to drop straight into your manuscript. Provides an acceptability table by subscale and, if it detects a low alpha (<.60), states this openly rather than hiding it. Suitable for: graduate students and researchers using scales who want to write the method section quickly and correctly.
 Image
ImageAcademic Paper to Diagram Generator
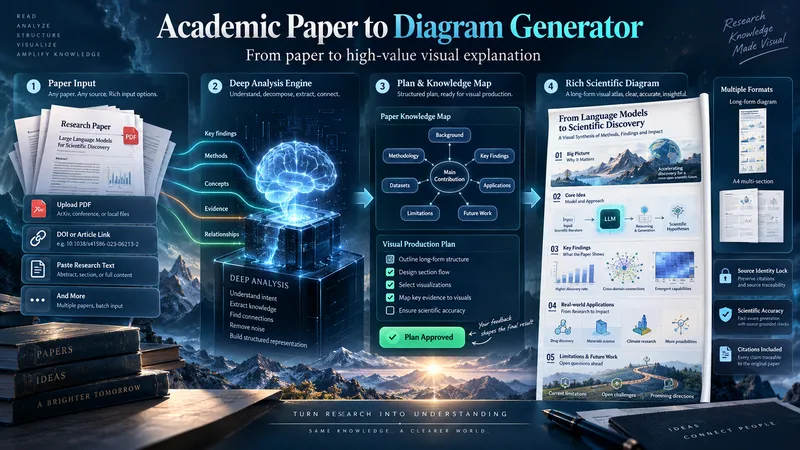
Transform academic papers into detailed, scientifically faithful visual diagrams. The skill deeply analyzes the paper, identifies its most valuable concepts, mechanisms, methods, findings, and relationships, then builds a visual plan with you before generation. Instead of forcing every paper into a small infographic, it can create long vertical diagrams, wide technical maps, multi-section visual explainers, or A4-ready 2–3 part layouts when needed. The visual style is adapted to the subject, with room for AI-driven creativity, scientific illustration, data integration, annotations, and topic-specific visual storytelling. You can start with a PDF, URL, DOI, pasted text, or a request to find a suitable paper. The diagram language is user-approved, the source identity is locked for accuracy, and the final image is generated only after you review the visual plan and production prompt.
Information
- Version
- v2
- Last updated
- Runtime credits
- Usage-based
- Models
- Auto
