
好大瓜——专业调查级信息审计官
吃瓜前先过一遍 X 光——用专业视角帮你看穿热点文章里藏了什么
好大瓜——专业调查级信息审计官
吃瓜前先过一遍 X 光——用专业视角帮你看穿热点文章里藏了什么
Showcase
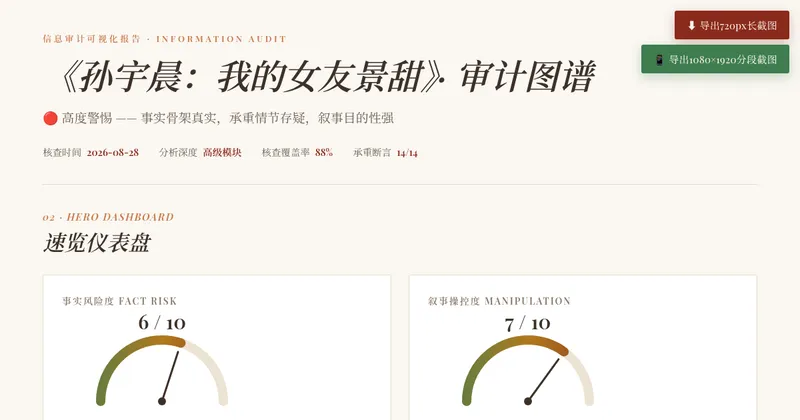
演示-《孙宇晨:我的女友景甜》PDF信息审计核查
孙宇晨景甜:审计图谱
演示-《孙宇晨:我的女友景甜》PDF信息审计核查
孙宇晨景甜:审计图谱
Description
面对刷屏的爆料长文、明星声明、商业互撕、社会争议……你是不是也想知道:这篇东西到底有几分真?哪些地方在带节奏?发布者到底想让我信什么? 👉把文章丢给我,我会像调查记者一样逐句拆解——事实核查、逻辑审计、操控手法识别、利益关系透视,一步到位。 👉你会收到一份结构清晰的调查简报,还可以生成带有专业图表的 HTML 可视化报告,让数据和逻辑一目了然。不预设立场,不站队,帮你看清全貌。
Related Skills
View all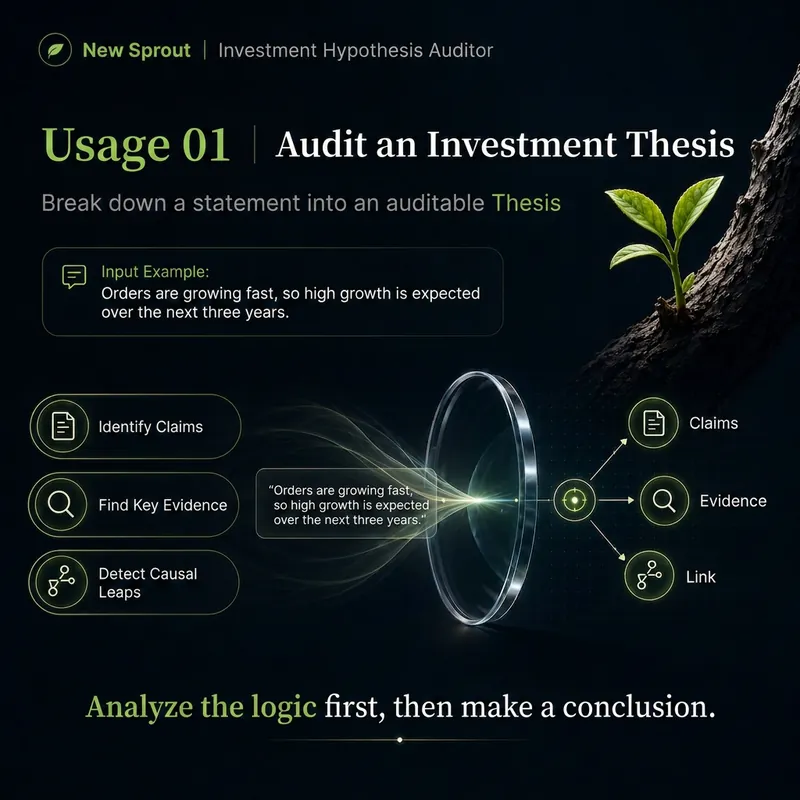 Research
Sprout | Thesis Auditor
Don't help prove my thesis. Help audit it. Many investment judgments fail not because the data is entirely wrong, but because accurate data supports an overextended conclusion. For example: “AI orders are abundant, so profits will definitely grow rapidly over the next three years.” “The company's business is strong, so the stock is cheap right now.” “Customers keep increasing, so the company has already achieved network effects.” “Management says the technology is leading, and it is stated in the financial report, so the moat has been proven.” 「Sprout | Thesis Auditor」does not help you find more reasons to prove yourself right. It breaks your investment thesis into an auditable Critical Path and checks each layer: Facts → Evidence → Causal Relationships → Hidden Assumptions → Commercialization → Economic Outcomes → Valuation By prioritizing primary sources, it answers the questions that truly matter: Which parts have already been supported by evidence? Which are merely reasonable inferences? Which necessary link is most fragile? Is there counterevidence that genuinely attacks the Thesis? What evidence is most likely to change the conclusion? It ultimately assigns one of five ratings: SUPPORTED / PARTIALLY SUPPORTED / FRAGILE / BROKEN / INSUFFICIENT DATA The conclusion must be traceable to specific Necessary Claims and evidence, rather than a vague “on balance” assessment.

Fact Check
Hand any opinion, conclusion, data point, or proposal to an AI fact-checker: online source tracing, five-level credibility ratings, and reasoning-chain analysis—followed by a fact-check report you can share directly. 【What it does】Paste any claim, and the skill completes three checks automatically: 🔍 Break it down—separates the claim into “verifiable facts / inferred conclusions / value judgments,” keeping positions distinct from facts 🌐 Trace sources online—verifies sources, samples, statistical definitions, dates, and full context point by point, with cross-checking across multiple channels 🧩 Check the reasoning chain—identifies hidden assumptions, correlation-versus-causation errors, omitted alternative explanations, and the conditions under which the conclusion holds or fails 【Why choose it】 ✅ Five-level credibility ratings: Confirmed / Generally sound but should be narrowed / Contested / Insufficient evidence / Clearly false, with source links for every item ✅ Four-part report: Reliable facts and corrections / The most critical flaws in the reasoning chain / The strongest revised version / How much you can trust it ✅ No made-up answers: When a claim cannot be verified, it is honestly marked “Insufficient evidence” instead of being passed off as “possibly true” ✅ Report-ready output: Share it directly with readers, clients, or your community 【Who it’s for】Independent media and content creators, investors and analysts, students and researchers, and anyone who needs to quickly decide whether a statement can be trusted. 【How to use it】Paste the claim you want checked—anything from one sentence to a paragraph. For example, enter “People with Hashimoto’s thyroiditis often have low energy” to get a source-backed, tiered fact-check report. ⚠️ For medical, legal, investment, and other professional questions, use this for information verification only and rely on qualified professionals for advice.
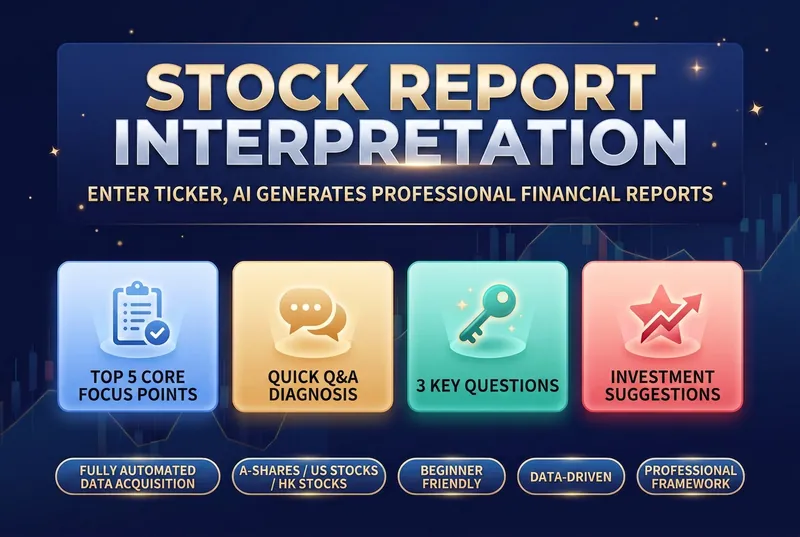
Stock Report Analyzer
Financial reports are a listed company's "physical exam report", but most investors feel lost when faced with pages of dense numbers: • 📝 Can't read the three financial statements — What do the balance sheet, income statement, and cash flow statement tell you? Which numbers matter most? • 🤔 Don't know what to look at — With dozens of pages, which key metrics should you focus on? • 📊 Lack an analysis framework — Even when you find the data, how do you judge good from bad and cross-check it? • 🏭 Industry standards differ — What counts as "good" varies completely by industry; manufacturing and internet companies can't be measured with the same yardstick. • ⏰ Time cost is too high — Manually looking up data, comparing peers, and calculating growth rates can take hours for one report. This skill was built to solve exactly these problems. It automates a professional financial analyst's framework, so you just need to enter a stock code to get a structured, logical, and beginner-friendly financial report interpretation. The tool's core value lies in its rigorous analysis framework, covering multiple dimensions from assessing growth quality to analyzing business models. It not only compares core metrics like revenue, gross margin, net margin, and cash flow, but also runs a quick Q&A on the seven key financial questions investors care about most. It clearly shows whether profits are turning into real cash, and whether receivables and inventory carry potential risks. By benchmarking against industry leaders, it helps you identify a company's true position in its industry chain. When generating the report, it also evaluates valuation levels, core strengths, and potential risks, and offers data-driven recommendations on what to watch. All analysis is presented in intuitive tables and plain, easy-to-understand language, turning complex accounting terms into concrete investment logic. Whether for daily review or deep research, it helps you quickly zero in on the core issue amid massive amounts of data, improving the efficiency and accuracy of your investment decisions.
Information
- Version
- v13
- Last updated
- Runtime credits
- Usage-based
- Models
- Auto
