
Minimal Explainer Diagram
Simple diagrams for reports and planning
Minimal Explainer Diagram
Simple diagrams for reports and planning
Showcase
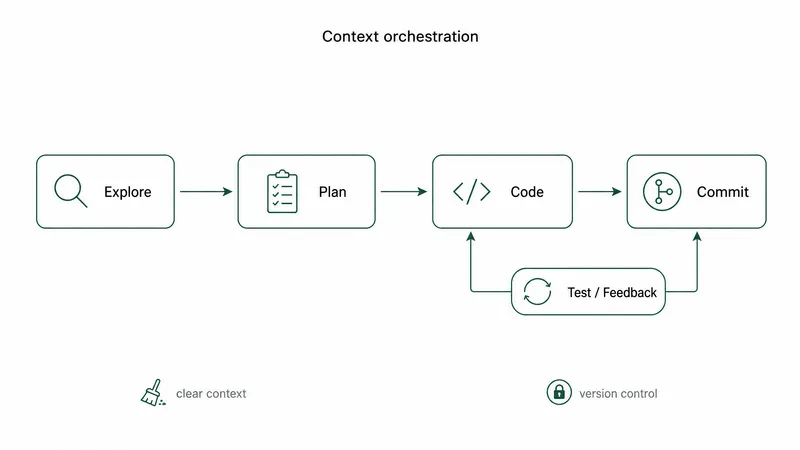
Agentic Coding Tools 使用指南提炼
Agentic Coding 高效工作流说明图
Agentic Coding Tools 使用指南提炼
Agentic Coding 高效工作流说明图
Description
Turn selected text, articles, files, or project information into a clear, compact explainer diagram. It extracts key nodes and relationships to help you organize processes, hierarchies, comparisons, timelines, or connections between different approaches. It’s suited to project presentations, team communication, content summaries, and organizing ideas. You can specify the diagram type, focus, layout direction, or accent color. Or simply provide the material, and it will determine a suitable way to present the content. It supports flowcharts, structure diagrams, comparison diagrams, timelines, and solution relationship diagrams. Before drawing, it lets you confirm the diagram type, layout, and colors to help prevent misunderstandings about the information’s focus. The finished diagram uses a white background, generous whitespace, fine lines, and flat geometric shapes, with a single low-saturation accent color. Short node labels and clear connecting lines show the relationships. It doesn’t crowd the original text or add people and decorative illustrations, so readers can quickly understand the content structure without first reading lengthy explanations.
Recommended by
淡苍
Why we love this skill
It extracts nodes and relationships, then confirms the diagram type, layout, and accent color before drawing—avoiding guesswork, information overload, and unapproved visual changes.
Related Skills
View all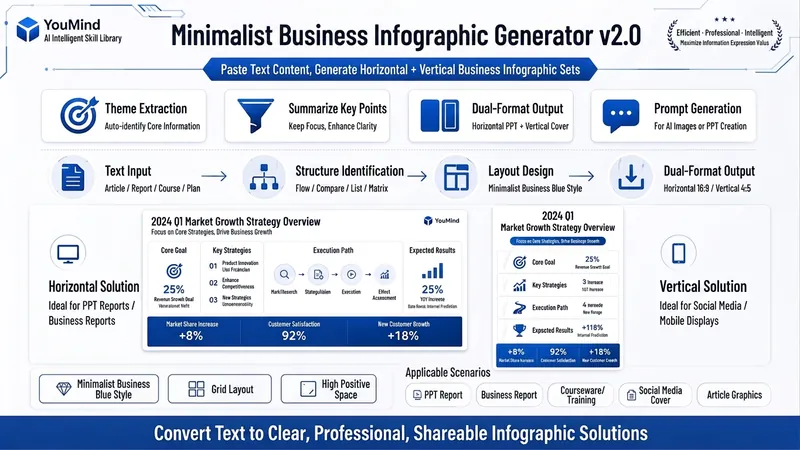 Image
ImageBiz Infographic Generator v2.0
Transforms complex text into clear, professional, presentation-ready business minimalist infographics. It can help you: 1. Automatically extract core information Extract topics, keywords, logical relationships, and key points from user-provided text, materials, course content, meeting minutes, or reports. 2. Automatically design infographic structure Match business expression formats such as flowcharts, comparison charts, hierarchical charts, matrix charts, checklist charts, and path charts based on content type. 3. Automatically generate dual-format solutions Output two sets of infographic designs: landscape and portrait. Landscape is suitable for PPT, presentations, and web display; portrait is suitable for Xiaohongshu, WeChat Moments, public account covers, and vertical screen display. 4. Automatically generate diagram prompts Output complete diagram prompts ready for use with AI drawing tools, designers, or PPT tools. Suitable for: Professionals, knowledge bloggers, trainers, course creators, consultants, operations staff, PPT designers, business report creators. How to use: Directly paste a piece of text, materials, course content, meeting minutes, or report summary. You don't need to organize the structure first; I will automatically extract the core content and generate both landscape and portrait business minimalist infographic solutions.
 Image
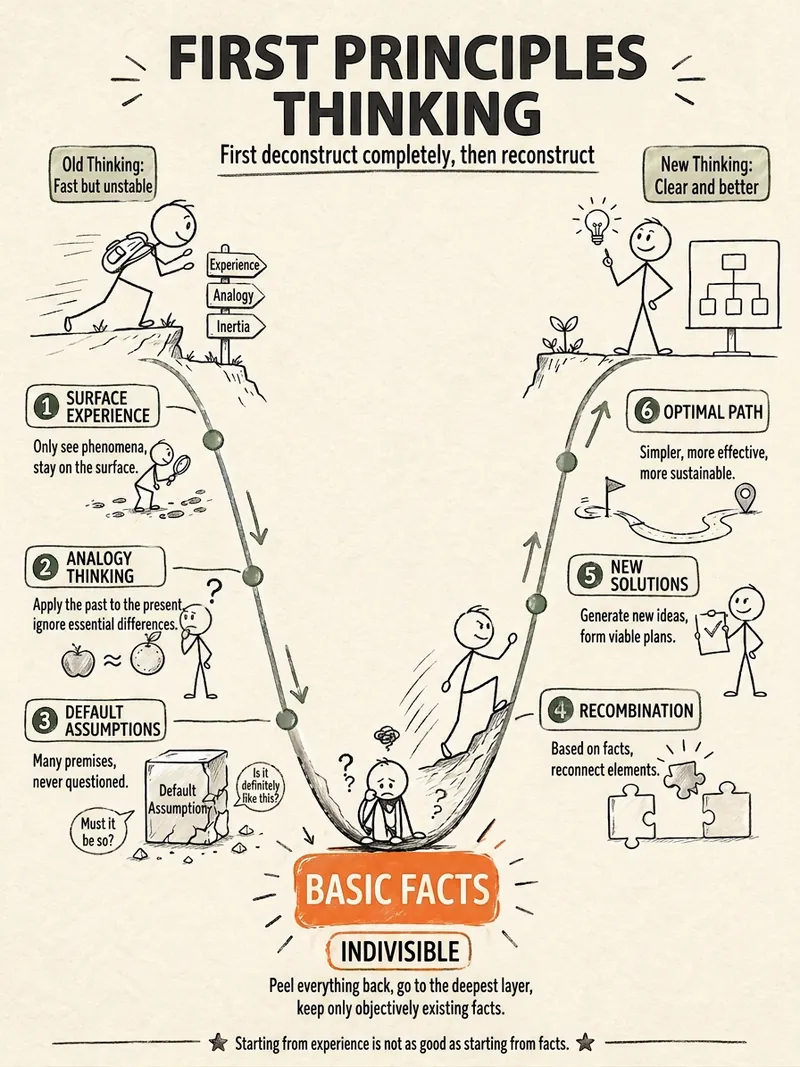
ImageStick Figure Explainer
Turn complex concepts, abstract theories, lengthy processes, notes, business analyses, or growth stories into prompts for vertical knowledge cards, infographics, and hand-drawn explainers optimized for GPT-Image 2. Whether you’re organizing a process, comparing before and after, analyzing causes, categorizing knowledge, or telling a story of growth from a low point to a breakthrough, it distills the key takeaway and matches it with a suitable composition, visual metaphor, and reading flow—making the content easier to understand and remember at a glance. You’ll receive a Chinese card structure guide and visual system recommendations covering composition, hand-drawn style, color philosophy, and typographic character, along with a ready-to-copy English image-generation Prompt. The default canvas is a 3:4 vertical format, suitable for knowledge cards, Xiaohongshu cards, vertical infographics, and posters. Depending on the topic, stick figures, simplified characters, or icons can be used to show states, actions, and emotions, while keeping the number of information modules under control to avoid crowded visuals, text that is too small, or scattered emphasis. It’s ideal for quickly turning reading notes, frameworks, workplace skills, psychology and personal growth topics, business insights, product workflows, and complex concepts into clear, narrative-driven, actionable visual content.
 Video
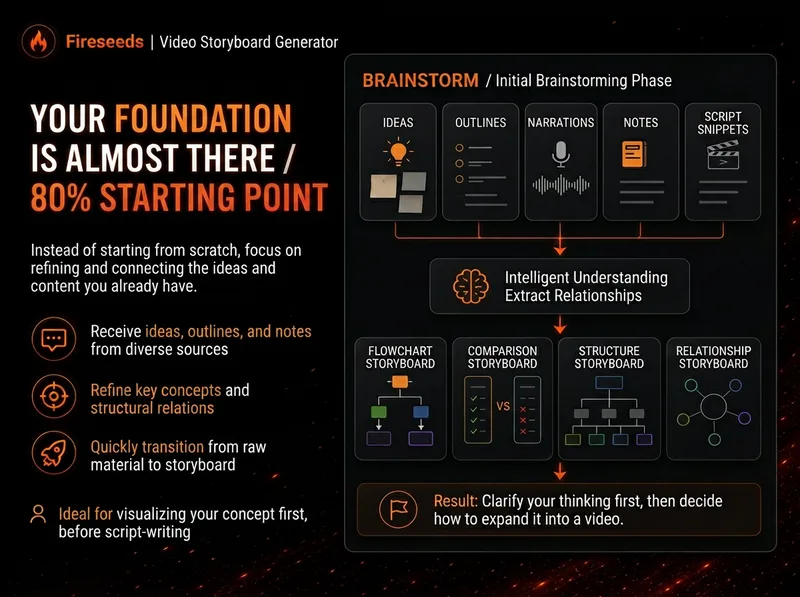
VideoSpark | Video Diagram Maker
Many videos don’t lack content—the content is simply too abstract or dense. Viewers understand one sentence, then forget it by the next. “Spark | Video Diagram Maker” takes your ideas, brainstorms, outlines, scripts, transcripts, or articles and first breaks them down into concepts that are genuinely worth visualizing. It then determines whether they are best expressed as a process, comparison, architecture, hierarchy, cycle, branch, decision tree, or another diagram structure. It won’t draw just to hit a quota, or cram complex content into one cluttered infographic. Multiple diagrams maintain the same visual language, naming, and semantic color system, making them easy to insert into videos as an explanatory framework. Especially useful for: Explaining complex concepts Breaking down workflows Comparing two methods Showing system structures Clarifying cause-and-effect relationships Turning a long brainstorm into a set of visual nodes for a video The default output is a 16:9 static diagram. If the runtime environment cannot provide an editable Excalidraw source file, this will be stated clearly; static images will never be presented as .excalidraw files. Use cases Use case 1 | Turn a brainstorm into diagrams You only have a long stream of spoken ideas, without a complete script. The Skill identifies the points most worth drawing and organizes them into a set of diagrams with a clear presentation order. Use case 2 | Turn a script into visual nodes for a video You already have a complete script but don’t know where to add visuals. The Skill determines which sections are worth visualizing and selects suitable diagram types. Use case 3 | Explain complex concepts For example: how an AI Agent works, why a workflow matters more than a one-off demonstration, how a business model operates, or which layers make up a product architecture. Use case 4 | Break down a workflow or process For example: topic pool → research → Hook → script → production → review. Use case 5 | Make comparisons For example: no workflow vs. a workflow; traditional methods vs. AI methods; one-time success vs. stable, repeatable results.
Information
- Version
- v5
- Last updated
- Runtime credits
- Usage-based
- Models
- Auto
