
Lecture Diagram Generator
Transcripts to Keynote infographics & notes
Lecture Diagram Generator
Transcripts to Keynote infographics & notes
Showcase










<EMPTY_PARAGRAPH>
做了些爆款 Skills 以后,我对 Skills 的看法(图片集)
<EMPTY_PARAGRAPH>
做了些爆款 Skills 以后,我对 Skills 的看法(图片集)
Description
Converts lecture transcripts into Keynote-style 16:9 teaching infographics, outputting both a text-and-image explanation version and a minimal image set. Each figure represents one concept with fine-grained breakdown. Four strict accuracy rules ensure quality, five visual pattern templates are used, every visual is individually QA checked, and programmatic verification is performed before delivery.
Why we love this skill
This skill intelligently converts lecture transcripts into Keynote-style teaching infographics and explanation documents, generating professional visual content with one click to refresh your presentations and learning materials.
Related Skills
View all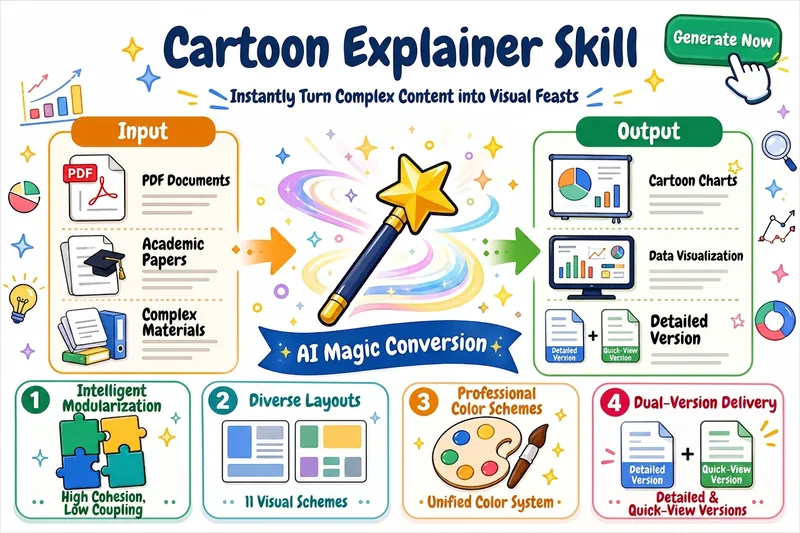 Image
ImageCartoon Explainer
Explain complex topics to beginners through a cartoon-style visual approach. Automatically divide content into modules and generate data-visualization-style cartoon images for each module (16:9, with white margins and a specific color scheme). Combine the original materials with AI-generated images to produce both full and simplified versions of the document, suitable for teaching and presentations.
 Image
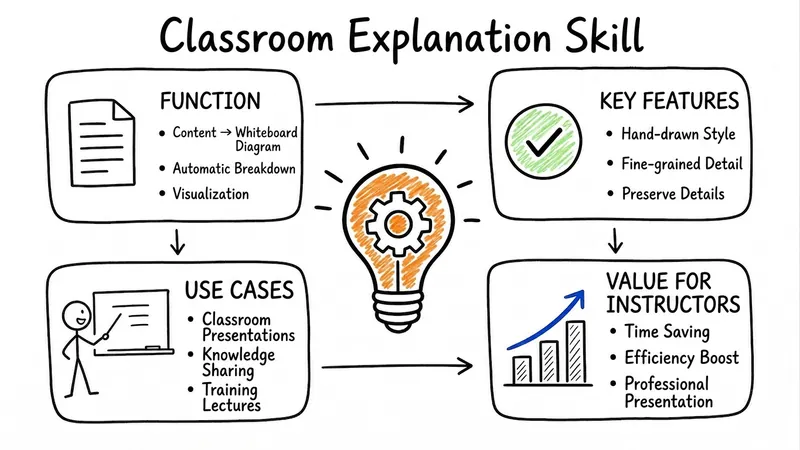
ImageLecture Sketchboard
Transform any content into a series of hand-drawn whiteboard infographics perfect for classroom teaching. Break down topics finely, keep essential details, and adapt content length automatically, providing lecturers with ample visual aids for their explanations.
 Video
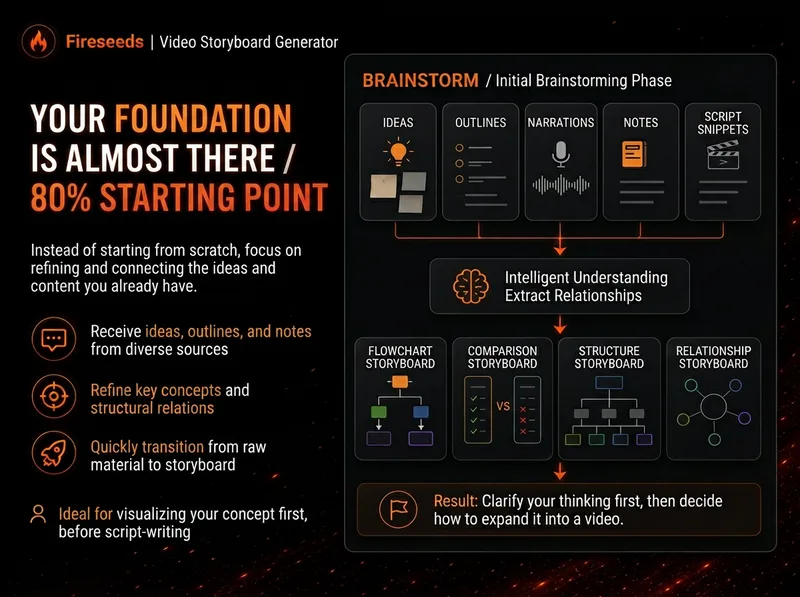
VideoSpark | Video Diagram Maker
Many videos don’t lack content—the content is simply too abstract or dense. Viewers understand one sentence, then forget it by the next. “Spark | Video Diagram Maker” takes your ideas, brainstorms, outlines, scripts, transcripts, or articles and first breaks them down into concepts that are genuinely worth visualizing. It then determines whether they are best expressed as a process, comparison, architecture, hierarchy, cycle, branch, decision tree, or another diagram structure. It won’t draw just to hit a quota, or cram complex content into one cluttered infographic. Multiple diagrams maintain the same visual language, naming, and semantic color system, making them easy to insert into videos as an explanatory framework. Especially useful for: Explaining complex concepts Breaking down workflows Comparing two methods Showing system structures Clarifying cause-and-effect relationships Turning a long brainstorm into a set of visual nodes for a video The default output is a 16:9 static diagram. If the runtime environment cannot provide an editable Excalidraw source file, this will be stated clearly; static images will never be presented as .excalidraw files. Use cases Use case 1 | Turn a brainstorm into diagrams You only have a long stream of spoken ideas, without a complete script. The Skill identifies the points most worth drawing and organizes them into a set of diagrams with a clear presentation order. Use case 2 | Turn a script into visual nodes for a video You already have a complete script but don’t know where to add visuals. The Skill determines which sections are worth visualizing and selects suitable diagram types. Use case 3 | Explain complex concepts For example: how an AI Agent works, why a workflow matters more than a one-off demonstration, how a business model operates, or which layers make up a product architecture. Use case 4 | Break down a workflow or process For example: topic pool → research → Hook → script → production → review. Use case 5 | Make comparisons For example: no workflow vs. a workflow; traditional methods vs. AI methods; one-time success vs. stable, repeatable results.
Information
- Version
- v7
- Last updated
- Runtime credits
- Usage-based
- Models
- Auto
