
Explorable Explainer Page Builder
Turn research into an interactive, accessible scrolly page
Explorable Explainer Page Builder
Turn research into an interactive, accessible scrolly page
Showcase
Description
A report explains. A page lets people find out for themselves. YouMind can already build webpages. Explorable Explainer decides what to build — it turns a piece of research, a dataset or a topic into a single interactive page in the tradition of newsroom graphics and explorable explanations: scroll-driven narrative, real charts, controls you can move, sources you can check. It plans before it codes. You approve a build plan first: the one question the page answers, the reveal — the moment the reader should feel "oh" — a five to eight section scroll spine, two to four interactions each justified by what the reader learns from moving it, and a data contract listing every number and where it came from. Then it builds one self-contained HTML file with no build step. Semantic markup. All numbers in a single editable DATA constant at the top. Scroll reveals that do not break on a phone. Every control a real, keyboard-operable form element with live text describing its current value. Accessibility is built in rather than bolted on: 4.5:1 contrast, visible focus rings, alt text everywhere, no meaning carried by colour alone, reduced-motion respected, responsive from 360px. Before handing over, it runs a five-point self-review and reports the results honestly: does the reveal actually land, does the page still read with JavaScript off, is the tab order sane, is every number traceable, is anything animating that a reader would want to stop. Two rules it will not break: it never invents data to make a chart look good, and it tells you when your numbers contradict your draft. For researchers, analysts, journalists, educators, indie founders and consultants who want their work to be explored rather than skimmed.
Recommended by
淡苍
Why we love this skill
An editor’s pick for turning research into something readers can test, not just read. It combines a disciplined reveal, traceable data, meaningful controls, and accessibility-first implementation, while refusing invented numbers and requiring honest self-review before handoff.
Related Skills
View all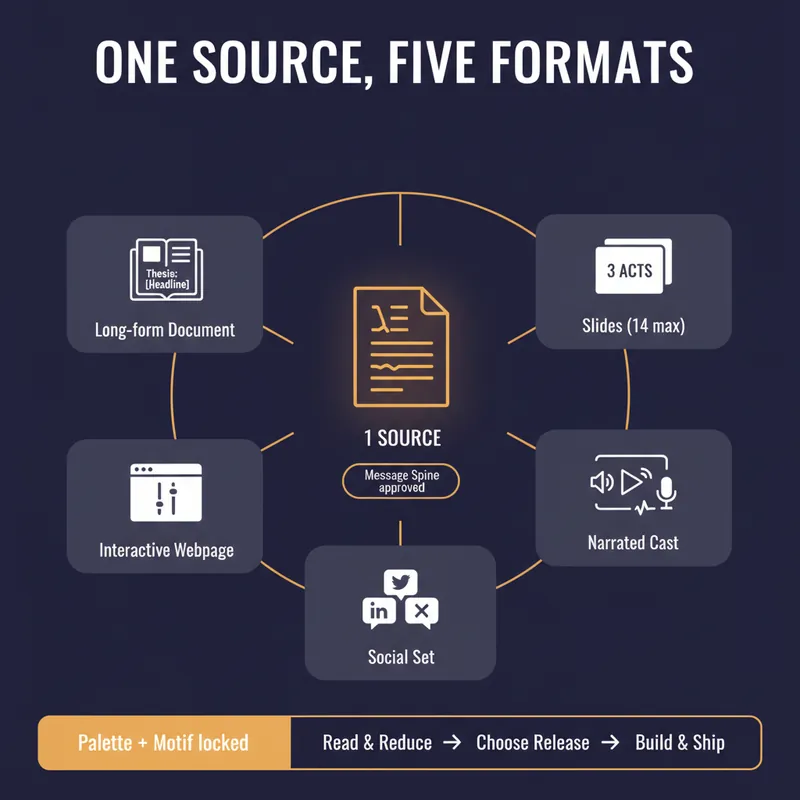 Write
WriteOne Source, Five Formats
YouMind can produce a document, a slide deck, a narrated video, an interactive webpage and a set of social posts. Most people use one of them, because doing all five by hand means writing the same argument five times and watching it drift a little further each time. This skill stops the drift by refusing to start until you have a spine. Before anything is generated it writes a Message Spine: one thesis under 25 words, three load-bearing points, the single strongest piece of evidence, the one image a reader should still have tomorrow, the change you want in them, and who this is explicitly not for. You approve it. Every format is then built from the spine, never from the previous format, so nothing compounds an earlier compromise. Then it tells you which formats are actually worth making. A short reflective essay makes bad slides. A dense data teardown makes bad audio. It will recommend two formats and explain why the other three would weaken the work, which is the opposite of what a content-multiplier is supposed to say. Each format gets built to its own rules, one at a time, with your confirmation. Slides get one idea per slide and speaker notes that carry the argument. The cast script is written for the ear, with numbers rounded and given a comparison and a deliberate pause before the strongest evidence. The webpage gets exactly one interactive move the flat text could not do. The social set opens each post on a different point so it does not read as three copies of itself, and every post gives away something real instead of begging for a click. One palette, one type treatment, one recurring motif, decided in writing before the first image is generated. You finish with a ship sheet: what goes where, in what order, how many days apart, with what call to action, and the one signal to watch. Plus a consistency check that quotes the thesis sentence from every format and confirms they still agree. It estimates credits before it spends them and never renders a full cast or image set without an explicit yes.
 Image
ImageAcademic Paper to Diagram Generator
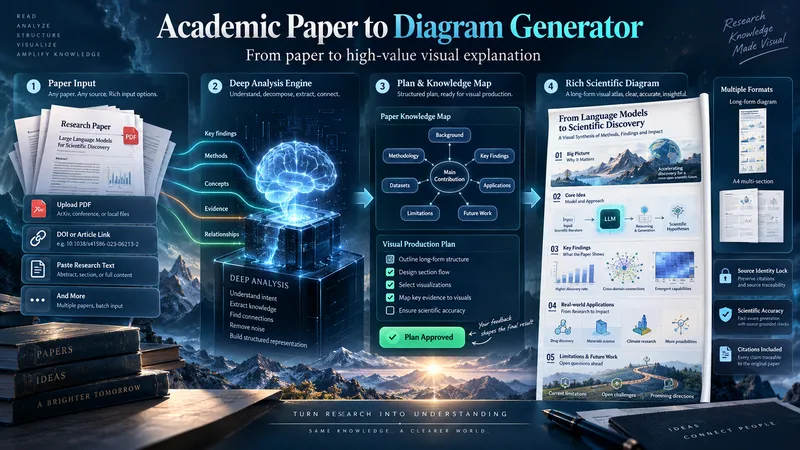
Transform academic papers into detailed, scientifically faithful visual diagrams. The skill deeply analyzes the paper, identifies its most valuable concepts, mechanisms, methods, findings, and relationships, then builds a visual plan with you before generation. Instead of forcing every paper into a small infographic, it can create long vertical diagrams, wide technical maps, multi-section visual explainers, or A4-ready 2–3 part layouts when needed. The visual style is adapted to the subject, with room for AI-driven creativity, scientific illustration, data integration, annotations, and topic-specific visual storytelling. You can start with a PDF, URL, DOI, pasted text, or a request to find a suitable paper. The diagram language is user-approved, the source identity is locked for accuracy, and the final image is generated only after you review the visual plan and production prompt.
 Image
ImageClay Isometric Explainer Studio
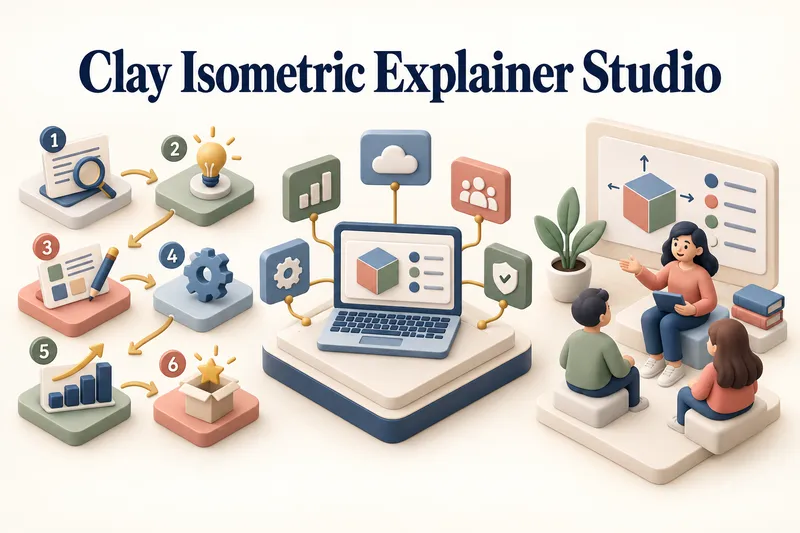
Turn any topic into a clear, memorable visual explanation. Clay Isometric Explainer Studio transforms products, processes, services, systems, and educational subjects into polished hybrid 3D clay and isometric visuals. You can start with only a topic. The Studio performs a focused research snapshot, identifies the core message, recommends the clearest visual direction, and guides you through the creative process step by step. It builds the information architecture, maps each idea to a visual object, defines a consistent style system, and prepares a complete production prompt. Titles, numbered stages, information cards, labels, and short explanations are planned and included directly during image generation. Choose an Explainer Scene, Process Flow, Product Feature Board, Educational Visual, or a coherent 3–5-piece Visual Series. After the still image is approved, optionally turn it into a short image-to-video animation with subtle object motion, natural clay character gestures, or guided focus through numbered stages. Ideal for presentations, websites, social posts, posters, PDF pages, product communication, onboarding, and learning materials. Not intended for decorative 3D scenes without an explanatory purpose, random visual elements, dense paragraphs inside images, or final editable design files.
Information
- Version
- v3
- Last updated
- Runtime credits
- Usage-based
- Models
- Auto
