
HR Flowchart Specialist
Turn HR SOPs into editable diagrams
HR Flowchart Specialist
Turn HR SOPs into editable diagrams
Showcase
Description
A dedicated flowchart skill for HR teams (v1.1). Paste SOP text or organization/role information—or upload a policy document—and the skill automatically determines the diagram type: HR process content produces a swimlane flowchart, while organization, headcount, and talent information produces an org chart. The process has four steps: ① Conversational needs assessment that identifies missing details and guides you to complete the process; ② Generation of a “structural specification (IR)” as the single blueprint for swimlanes, nodes, connectors, and visual mapping; ③ Compilation into an editable Excalidraw file that preserves element IDs, text containers, and arrow bindings, followed by PNG/SVG export. Before delivery, a “validation gate + render self-check” helps prevent text overflow, dangling arrows, and isolated nodes; ④ Incremental editing for changing text, moving, resizing, restyling, deleting, or adding elements—only the specified nodes are changed, leaving the rest of the diagram untouched. It includes a library of common HR process families and consistent visual guidelines, using Peking University red (#B31B1B) as the primary color. It solves the HR pain points of time-consuming manual diagramming and having to rework an entire diagram to change one node: diagrams are made for editing, images are made for sharing.
Related Skills
View all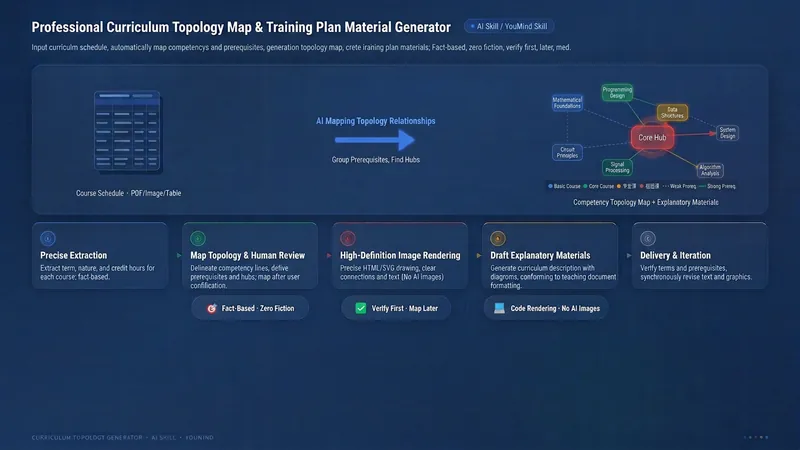
Professional Course Topology Diagram and Curriculum Program Material Generator
Input a professional course schedule, and the system automatically identifies competency lines and prerequisite relationships, generates a high-definition topology diagram using code, and produces training program description materials; it is fact-anchored with zero fabrication, and the diagram is created only after verification. Input the professional course offerings in any university's talent training program (PDF/image/text table are all acceptable), and the system automatically identifies the topological relationships between courses—grouping them by professional competency lines, identifying strong prerequisite dependencies and competency responses, locating core hub nodes, handling limited elective/specialized courses, and connecting them to the internship in the 5th/6th semester; then, it uses HTML/SVG code to accurately render a high-definition course topology diagram with clear Chinese characters and unblurred lines (not an AI-generated diagram), and finally produces a talent training program curriculum system description material that conforms to the style of teaching documents and includes diagrams. Built-in fact-anchoring and manual verification gate control: course names/nature/class hours are strictly faithful to the original table with zero fabrication; prerequisite relationships are clearly marked as teaching logical inferences and are verified by the user before diagram creation; information such as unfounded curriculum standard adjustments is never fabricated.
 Video
VideoSpark | Video Diagram Maker
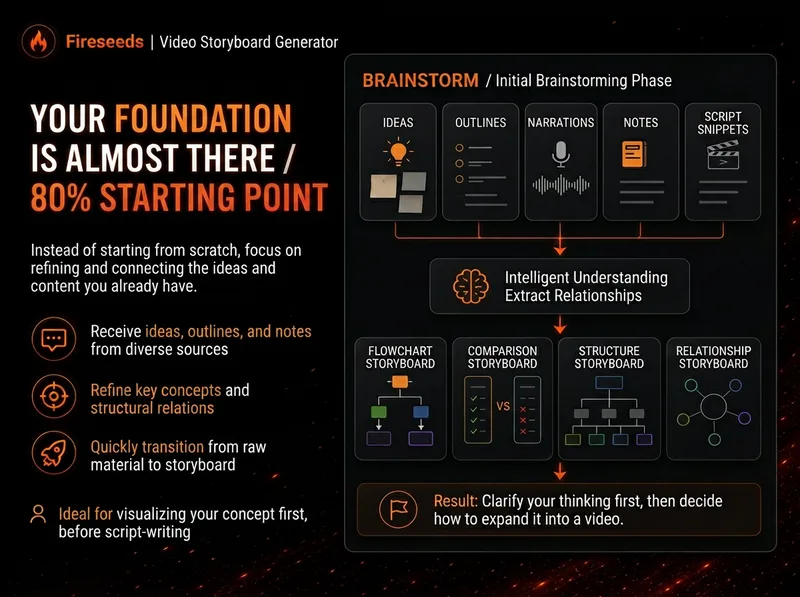
Many videos don’t lack content—the content is simply too abstract or dense. Viewers understand one sentence, then forget it by the next. “Spark | Video Diagram Maker” takes your ideas, brainstorms, outlines, scripts, transcripts, or articles and first breaks them down into concepts that are genuinely worth visualizing. It then determines whether they are best expressed as a process, comparison, architecture, hierarchy, cycle, branch, decision tree, or another diagram structure. It won’t draw just to hit a quota, or cram complex content into one cluttered infographic. Multiple diagrams maintain the same visual language, naming, and semantic color system, making them easy to insert into videos as an explanatory framework. Especially useful for: Explaining complex concepts Breaking down workflows Comparing two methods Showing system structures Clarifying cause-and-effect relationships Turning a long brainstorm into a set of visual nodes for a video The default output is a 16:9 static diagram. If the runtime environment cannot provide an editable Excalidraw source file, this will be stated clearly; static images will never be presented as .excalidraw files. Use cases Use case 1 | Turn a brainstorm into diagrams You only have a long stream of spoken ideas, without a complete script. The Skill identifies the points most worth drawing and organizes them into a set of diagrams with a clear presentation order. Use case 2 | Turn a script into visual nodes for a video You already have a complete script but don’t know where to add visuals. The Skill determines which sections are worth visualizing and selects suitable diagram types. Use case 3 | Explain complex concepts For example: how an AI Agent works, why a workflow matters more than a one-off demonstration, how a business model operates, or which layers make up a product architecture. Use case 4 | Break down a workflow or process For example: topic pool → research → Hook → script → production → review. Use case 5 | Make comparisons For example: no workflow vs. a workflow; traditional methods vs. AI methods; one-time success vs. stable, repeatable results.

Research, Course & Media
Research, Teaching Reform, Course Development & Media Visual Generator is a visual design Skill for research and teaching reform charts, social media visuals, and course development diagrams. It first identifies the visual type, offers options from suitable structure or style libraries, and then presents a complete design plan. It generates the visual only after receiving the user's explicit approval, and checks the content, relationships, Chinese text, composition, people, and visual quality before delivery. Research, Teaching Reform, Course Development & Media Visual Generator can turn research materials, course content, and social media topics into clear, polished visual concepts that match your personal aesthetic. It supports technical roadmaps, theoretical mechanism diagrams, research framework diagrams, course system diagrams, role–competency–course mapping diagrams, WeChat Official Account header images, knowledge infographics, scene illustrations, and multipage graphic cards. The Skill first translates the content into “topic—nodes—relationships—hierarchy—capacity—medium,” then recommends 3–5 suitable structures or styles and presents the composition, color palette, materials, lighting, text treatment, rendering method, and risks. It does not generate images without user approval. After the user changes the content, structure, style, color palette, or dimensions, it updates the plan and waits for approval again. Research and course diagrams prioritize editable, deterministic rendering with accurate relationships. Social media and scene visuals use text-free image generation with reliable text overlays.
Information
- Version
- v4
- Last updated
- Runtime credits
- Usage-based
- Models
- Auto
