Geography Illustrated
Visual cards for geography and science
Geography Illustrated
Visual cards for geography and science
Showcase
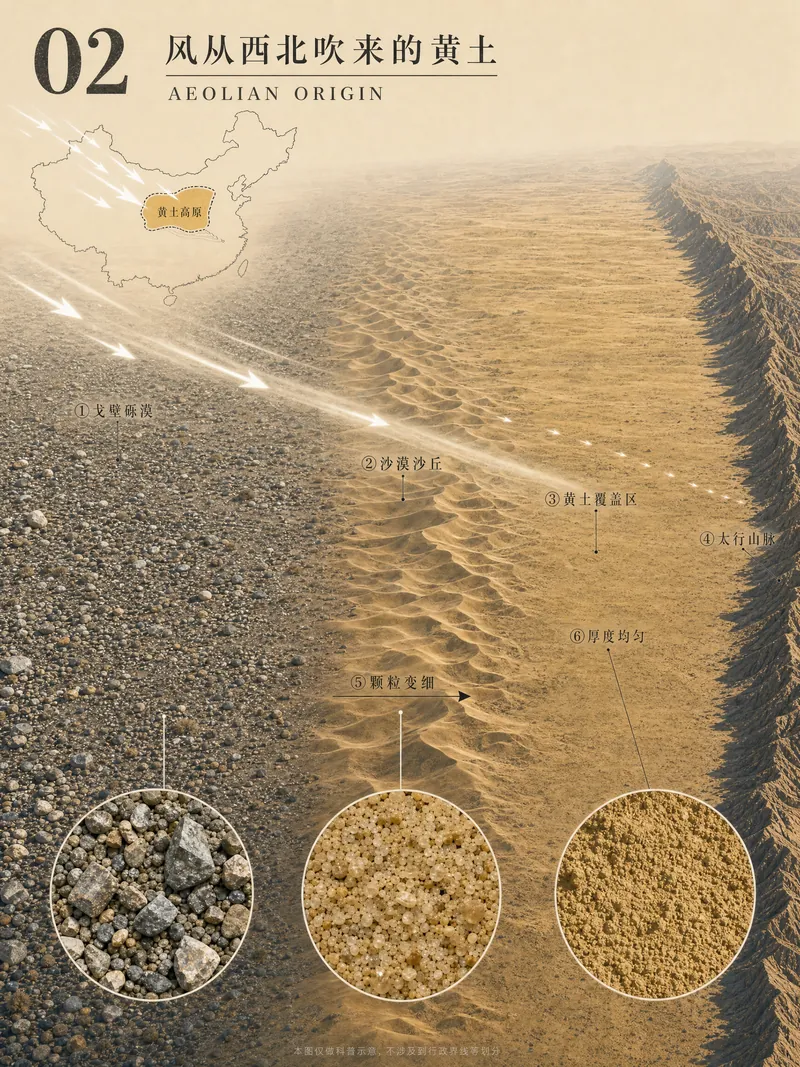
黄土高原图解绘制
黄土高原图解02-风从西北吹来的黄土(修改版3)
黄土高原图解绘制
黄土高原图解02-风从西北吹来的黄土(修改版3)
Description
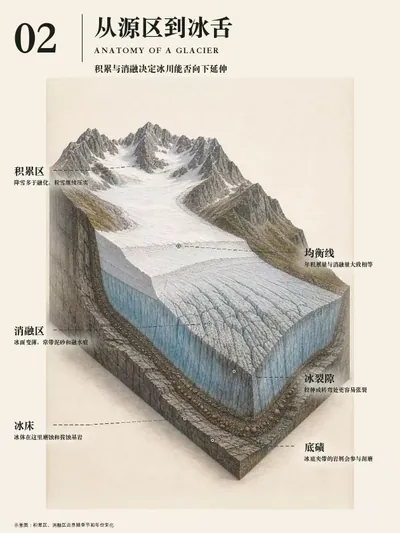
Enter a geography concept name to generate a set of 8 vertical 3:4 illustrated cards that break down complex geography knowledge into a coherent visual narrative, suitable for high school geography teaching and science communication.
Related Skills
View all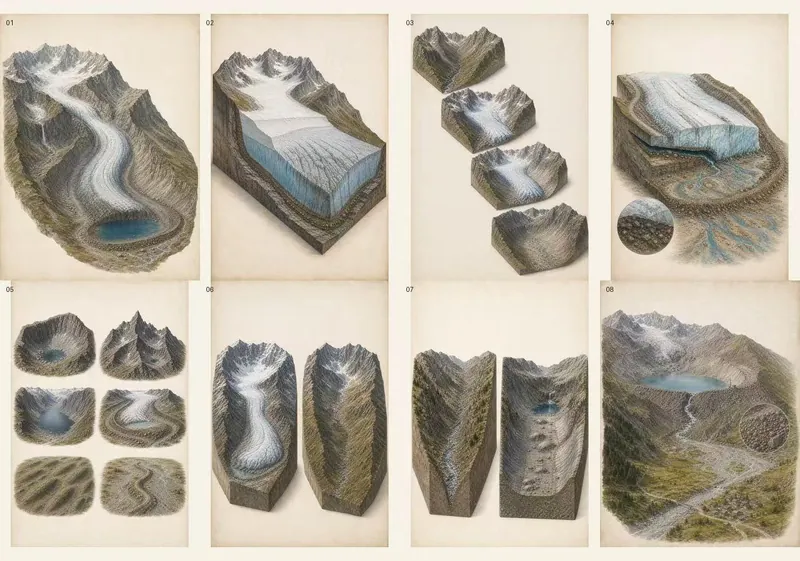
图解地理景观(适合PPT版)
Create complete 8-card “万物图解” geography series: warm-paper low-saturation 3:4 portrait explainers with coherent landscape models, cutaways, process stages, selective material or energy flows, precise visible-target labels, micro-detail insets, comparisons, and deterministic Chinese typography. Use when the user gives any landform, geology, climate, atmosphere, hydrology, ocean, ecosystem, settlement, resource, hazard, or other geography concept and asks for 万物图解、八张图解、地理概念拆解图、立体剖切图、景观分解图、机制示意图、公众号/小红书科普图,or asks to match the visual language of “万物图解局”.
 Image
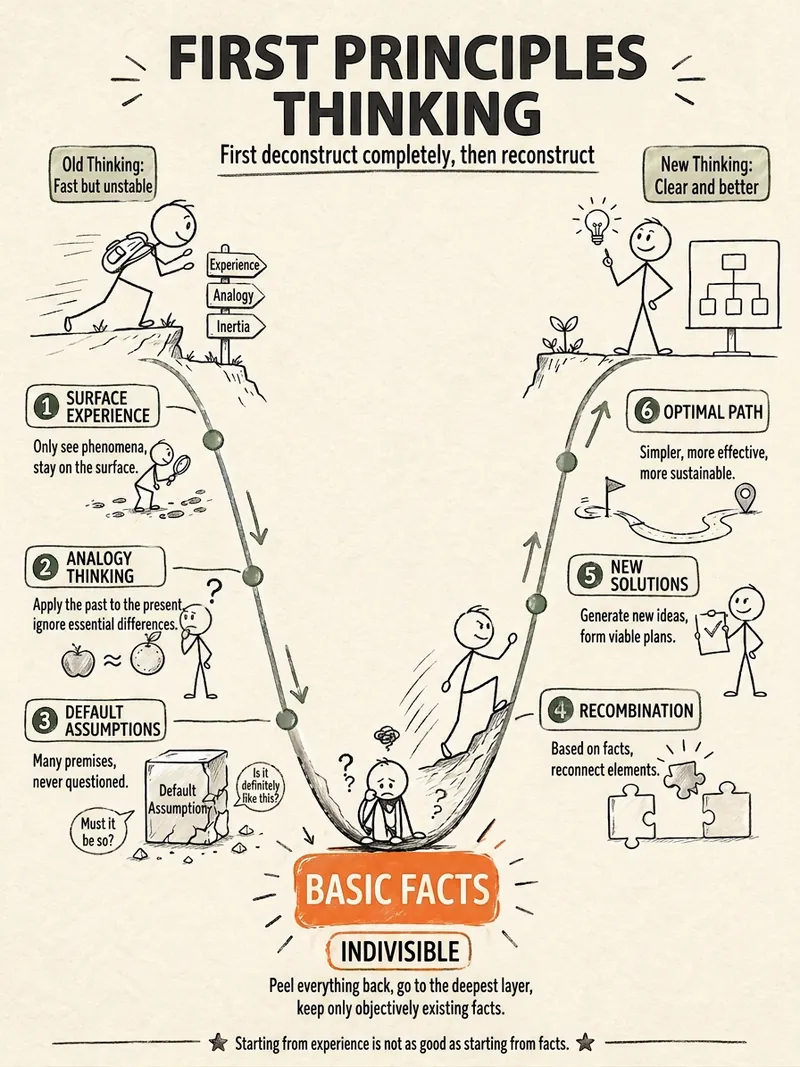
ImageStick Figure Explainer
Turn complex concepts, abstract theories, lengthy processes, notes, business analyses, or growth stories into prompts for vertical knowledge cards, infographics, and hand-drawn explainers optimized for GPT-Image 2. Whether you’re organizing a process, comparing before and after, analyzing causes, categorizing knowledge, or telling a story of growth from a low point to a breakthrough, it distills the key takeaway and matches it with a suitable composition, visual metaphor, and reading flow—making the content easier to understand and remember at a glance. You’ll receive a Chinese card structure guide and visual system recommendations covering composition, hand-drawn style, color philosophy, and typographic character, along with a ready-to-copy English image-generation Prompt. The default canvas is a 3:4 vertical format, suitable for knowledge cards, Xiaohongshu cards, vertical infographics, and posters. Depending on the topic, stick figures, simplified characters, or icons can be used to show states, actions, and emotions, while keeping the number of information modules under control to avoid crowded visuals, text that is too small, or scattered emphasis. It’s ideal for quickly turning reading notes, frameworks, workplace skills, psychology and personal growth topics, business insights, product workflows, and complex concepts into clear, narrative-driven, actionable visual content.
 Image
Image(Trending) Anything as an Infographic
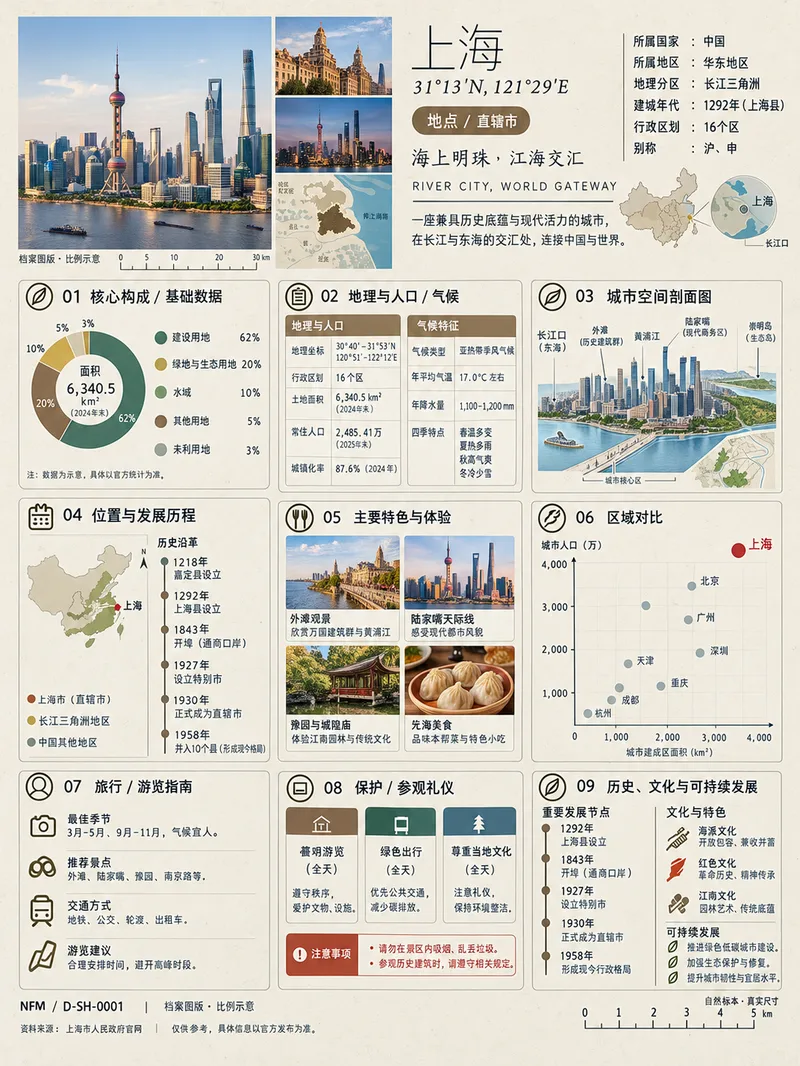
A trending infographic generator. Enter the name of any subject, and it automatically identifies the type—such as a living thing, mineral or material, man-made object, place or building, cultural concept, or historical figure—then creates a dense 3:4 portrait infographic poster using a fixed “natural specimen archive × modern museum guide plaque” layout system. It includes a header identification area, specimen-style image area, a central 3×3 grid with a core data radial chart, detailed key metrics, structural cross-section, spatial and temporal distribution, applications and user experience, side-by-side comparison, identification guide, preservation and maintenance, and historical lineage, plus a collection number and reference information area at the bottom. The layout, grid, typography, and color systems are consistent, making the posters easy to collect as a series. GPT Image 2 is used by default as the best-fit image generation model. Best for: building an account from scratch and taking commissioned work.
Information
- Version
- v8
- Last updated
- Runtime credits
- Usage-based
- Models
- Auto
