
Showcase

Description
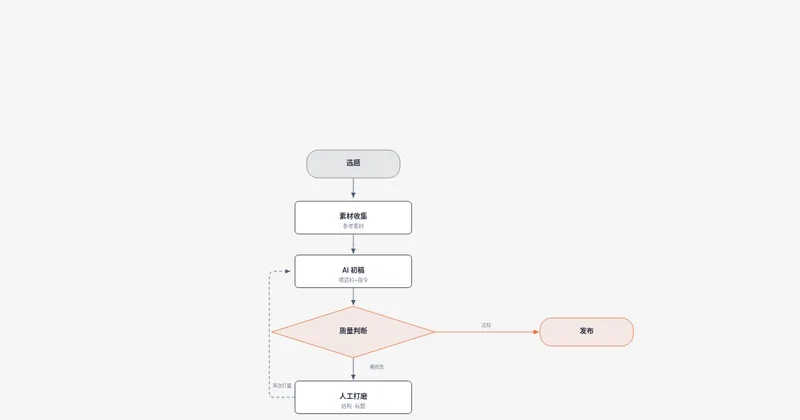
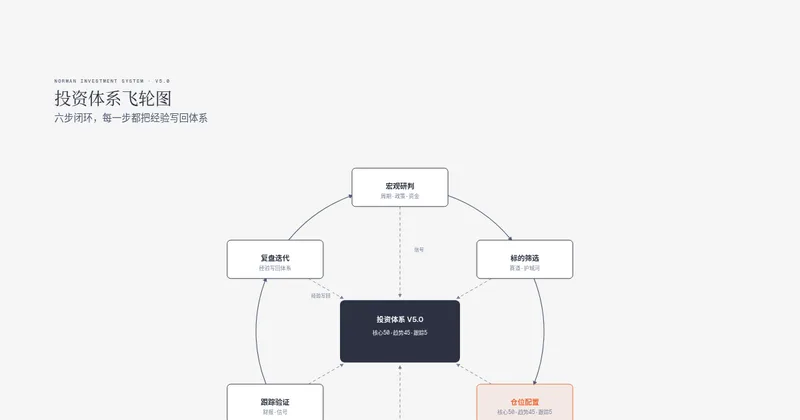
Create branded architecture, IT current-state, flowchart, sequence, state machine, ER/data model, timeline, swimlane, quadrant, radar/spider, polar chart (polar/radial lollipop), loop/flywheel, nested, tree, org chart, layer stack, Venn, pyramid/funnel, treemap, bar, line, Gantt and scatter charts, high-level, process, medallion, data flow, DP integration, DP security matrix, Sankey, fishbone, Wardley map, kanban, user journey, deployment, dependency graph, UML class, story map, or database schema diagrams as standalone HTML/SVG/PNG. Redraw .drawio/.drawio.png/.drawio.svg or Mermaid .mmd sources at a chosen size/detail; onboard brand tokens from a website; add semantic patterns, callouts, accessible motion, or sketchy/hand-drawn styling.
Related Skills
View all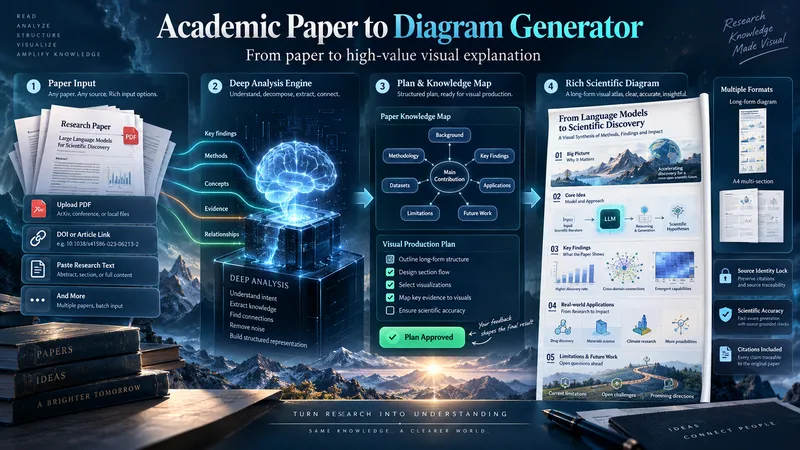 Image
ImageAcademic Paper to Diagram Generator
Transform academic papers into detailed, scientifically faithful visual diagrams. The skill deeply analyzes the paper, identifies its most valuable concepts, mechanisms, methods, findings, and relationships, then builds a visual plan with you before generation. Instead of forcing every paper into a small infographic, it can create long vertical diagrams, wide technical maps, multi-section visual explainers, or A4-ready 2–3 part layouts when needed. The visual style is adapted to the subject, with room for AI-driven creativity, scientific illustration, data integration, annotations, and topic-specific visual storytelling. You can start with a PDF, URL, DOI, pasted text, or a request to find a suitable paper. The diagram language is user-approved, the source identity is locked for accuracy, and the final image is generated only after you review the visual plan and production prompt.
 Image
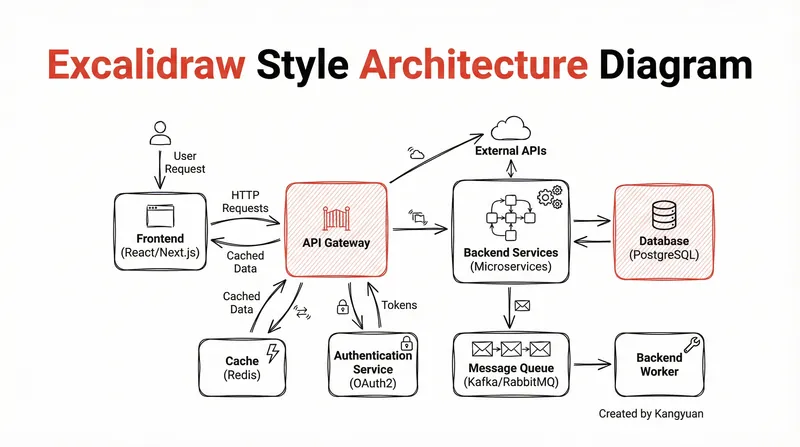
ImageExcalidraw-style diagram
Transform complex system designs into clear, hand-drawn Excalidraw diagrams. Visualize your architecture with minimalist elegance, making intricate connections instantly understandable and professionally presented.

Generate Academic Graphics
Transforms textual descriptions of research concepts into publication-ready academic visualizations following APA figure guidelines. Automatically analyzes content structure and selects the optimal diagram type (flow chart, framework diagram, hierarchical diagram, network diagram, or cycle diagram) to create professional graphics suitable for peer-reviewed journal submission.
Information
- Version
- v4
- Last updated
- Runtime credits
- Usage-based
- Models
- Auto
