
9D Visual Deconstruction
Break down infographics into reusable prompts
9D Visual Deconstruction
Break down infographics into reusable prompts
Showcase
Description
Break down one or more infographics, data visualizations, flowcharts, timelines, maps, knowledge graphs, and organizational charts into reusable visual and information structures. Understand precisely why an image is organized the way it is and reconstruct a similar communicative effect. The skill examines spatial composition, dimensionality and materials, color hierarchy, typography and layout, and module relationships, while also identifying chart encodings, reading paths, visual-symbol metaphors, and geographic or network relationships—so the analysis goes beyond simply describing what the style resembles. You will receive a parameterized visual deconstruction covering the canvas and compositional logic, visual hierarchy, text density, module topology, ways of expressing data and relationships, and the narrative flow within the image. For statistical charts, maps, and relationship networks, the output focuses on how data is mapped to visual variables such as color, position, size, connecting lines, and nodes. For complex subject-specific visuals, it further organizes the coordinated relationships among graphics, text, and metaphor systems. Based on this analysis, the skill generates detailed, clearly structured English image-generation prompts suitable for infographic recreation, visual research, design reference, brand content exploration, and concept development. Whether you provide an existing image or an idea for a theme and visual direction, you will receive prompts aimed at reproducing the underlying structure—not just a vague description of the style.
Related Skills
View all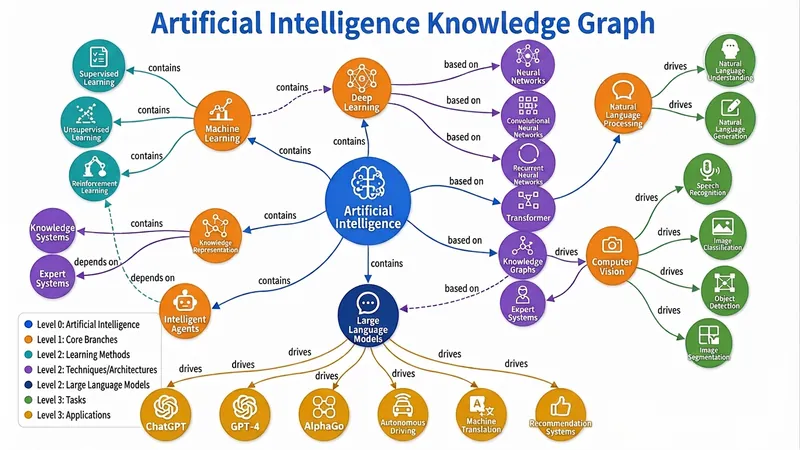
Knowledge Graph Engine
Automatically build five types of diagrams (Knowledge Graph, Mind Map, Concept Map, Flowchart/Architecture Diagram, Relation Diagram) from text, files, or topics, and output an interactive web page, static image, and visualization code all in one — a triple-threat solution built to the highest standards. Combines best practices from knowledge graph engineering and information visualization, supporting dynamic granularity control, disambiguation and deduplication, and multi-source cross-validation. Turn your words, files, or even a thought into a draggable, zoomable, searchable interactive knowledge graph in seconds, and export high-definition images and ready-to-use code with one click — this is the knowledge visualization "triple-threat" engine you've never experienced before. 🧠 What is the Knowledge Graph Engine? It's not the simple drawing tool you've seen before. It's a knowledge engineer + visualization expert hidden in your browser. Give it a textbook passage, a thesis, a PDF, or just a keyword, and it will automatically: 🔍 Extract core entities and clarify deep relationships 🧱 Build structured graph JSON (Knowledge Graph / Mind Map / Concept Map / Flowchart / Relation Diagram) 🎨 Output three top-tier forms: interactive web page + high-definition static image + Markdown/Mermaid/Graphviz code From now on, information organization doesn't rely on manual box drawing, and knowledge presentation is no longer just a static picture. ⚡ Why is it "top-tier"? 1. Fully automatic "text-to-graph" pipeline: No need to learn any modeling language or manually define nodes and connections. Just input content, and the engine automatically determines the graph type: Subject knowledge system? → Generates a semantically rich knowledge graph Reading notes deconstruction? → Generates a clear hierarchical mind map Process and decision? → Generates a flowchart/architecture diagram with branches Character relationship network? → Generates a multi-dimensional relation diagram Even if you just throw a topic word, it can independently gather information, fill in the content, and then generate the graph. 2. Triple-threat output covering all use cases: 🖱️ Interactive D3.js web page: Drag nodes, scroll to zoom, click for details, highlight related paths, keyword search... like operating a living map. Single-file HTML, no backend, can be embedded directly into any page or sent to anyone. 🖼️ High-definition static graph: Force-directed layout, color-coded categories, directly usable for thesis illustrations, PPT presentations, teaching materials — every label is sharp and readable. 📜 Visualization code: Generates both Mermaid and Graphviz source code simultaneously. Developers can directly insert into documentation, wiki, Notion, with unlimited expandability for secondary editing. 3. Ultimate user experience design: 🎨 Colors automatically mapped by entity type, hierarchy expressed intuitively by node size 🔗 Relationship labels displayed directly on curves — instantly see 'contains', 'causes', 'supports' 💡 Click any node, non-related parts auto-fade to focus on the thought path 🔄 Reset layout, search positioning, zoom and pan... all operations smooth as silk 4. Engineering wisdom balancing 'breadth' and 'depth': From entity disambiguation and deduplication to multi-source cross-validation; from hierarchical granularity control to dotted-line connections supporting cross-domain relationships — behind this are the best practices of knowledge graph engineering, not a toy but a productivity tool. 👥 Who needs it most? Teachers & Educational Content Creators: Turn entire textbook chapters into an interactive knowledge map — students click to understand concept relationships. Researchers & Students: Literature reviews no longer rely on text walls — one diagram clarifies the theoretical threads of dozens of papers. Product Managers & Enterprise Architects: System architecture, business processes, feature breakdown — instantly generate architecture diagrams, doubling communication efficiency. Readers & Lifelong Learners: Notes are no longer just outlines but explorable thought networks, letting knowledge truly 'grow' together. 🚀 Now, let your knowledge 'come alive' You give content, it gives insights. You give a topic, it gives a system. You give a requirement, it gives a complete deliverable of web pages, images, and code. This is not a feature; it's a workflow that elevates information into cognition. Let the Knowledge Graph Engine become an extension of your thinking, visualize your expertise, and reach every audience's 'aha moment.' — From today, don't 'draw' graphs, 'generate' graphs.
 Image
ImageMono no Aware, Wabi-Sabi & Yūgen
Turn themes, scenes, people, classical Chinese poetry, or photos into Japanese aesthetic images grounded in clear sources of thought and visual references—ideal for creators who need nuanced storytelling and art direction. The skill selects mono no aware, wabi-sabi, or yūgen as the primary direction based on the content: mono no aware expresses the beauty of what is fading, wabi-sabi reveals the marks left by materials and time, and yūgen creates understated depth through concealment, distance, negative space, and unseen areas. These aesthetics are combined only when the subject genuinely supports multiple aesthetic logics. You’ll receive a clear thematic assessment, primary aesthetic, relationship between combined styles, art-historical anchors, and core narrative. It then generates professional visual prompts covering the subject, setting, composition, spatial layers, materials, color, lighting, mood, and negative constraints—avoiding vague labels such as “Japanese,” “Zen-like,” or “sophisticated.” For portrait photos, it aims to preserve identity, facial structure, perceived age, body type, and key clothing features, transforming the aesthetic through environment, lighting, and narrative rather than automatically turning the person into someone wearing a kimono. After confirmation, the skill displays the complete prompt and generates an image, along with an aesthetic explanation to help you understand how the image expresses the beauty of transience, traces of time, or the unseen. It is suited to concept art, photography style transfer, classical Chinese poetry visualization, character-and-setting creation, spatial storytelling, and AI image generation with a Japanese aesthetic sensibility.
Image Generation Grandmaster
If you want to extract production-ready image-generation Skills from reference images on YouMind in one streamlined process, this is the grandmaster-level option. Creating a new Skill costs around 300 credits, turning you into an image-generation Skill-making machine and helping you avoid Skills that cost thousands. With reference images, you can build what you need yourself. Personally tested and effective; see the task examples for details. It distills the visual mechanisms in reference images into reusable, testable image-generation Skills. The subject can change while the composition, spatial logic, material appearance, and visual hierarchy are preserved, rather than simply copying the original image. It is suited to creators and teams that need to establish a consistent visual style, reuse design principles, or evaluate existing generation Skills. Use it to compile visual rules, test existing Skills, calibrate based on feedback, run historical regressions, and publish versions. It clearly identifies the scope of application, fixed invariants, adjustable variables, adaptation rules, and common failure modes. It also distinguishes between an image that is high quality and one that truly preserves the visual mechanism, helping you identify why a generated result has deviated from the underlying rules. The final results may include a structured visual specification, an independent Skill, a test plan or audit report, along with calibration patches, regression results, and release records. When image generation or visual inspection is unavailable, complete test prompts are retained and the pending-verification status is clearly indicated. Once confirmed, rules, failure diagnoses, and version information can continue to be recorded in YouMind for future maintenance and reuse.
Information
- Version
- v3
- Last updated
- Runtime credits
- Usage-based
- Models
- Auto
