
Self-Evolving A-Share Rotation
A-share: rebalance, validate, evolve, scan
Self-Evolving A-Share Rotation
A-share: rebalance, validate, evolve, scan
Showcase
Description
This skill provides A-share investors with a comprehensive strategy management and evolution platform, helping you systematically execute, validate, and optimize your trading strategies. It can intelligently adjust your monthly rebalancing strategy based on market conditions, and through rigorous backtesting, continuously evaluate strategy performance and provide in-depth diagnostics to ensure your investment approach stays in sync with the market. Using real-time market data analysis, this skill accurately identifies the current market environment (such as trending, range-bound, or bear markets) and applies preset parameter sets for stock screening. It employs a multi-layer funnel approach, starting with fundamental hard metrics to technical timing, then rigorous individual stock value analysis, and actively seeks counterevidence to avoid blind decisions. Ultimately, you receive an auditable candidate stock list, each with detailed rule-hit explanations, ensuring transparent and traceable decisions. Beyond strategy execution, this skill also offers powerful strategy validation and evolution capabilities. It automatically tracks and backfills your trading signal performance, generating detailed strategy health reports including win rate, profit/loss ratio, and excess returns over the CSI 300. When a strategy underperforms, it intelligently triggers evolution suggestions, performs attribution diagnostics to identify problematic rules, and supports parameter adjustments after paper trading validation to continuously refine your investment strategy. Notably, after each strategy execution or validation, this skill scans US, Hong Kong, and A-share markets to provide 'cross-market high expected value opportunities' with structural advantages. These opportunities are based on a rigorous expected value framework and come with clear entry, stop-loss, target, and position suggestions, but are not automatically written to your trading log. They serve as decision support references, helping broaden your investment perspective.
Related Skills
View all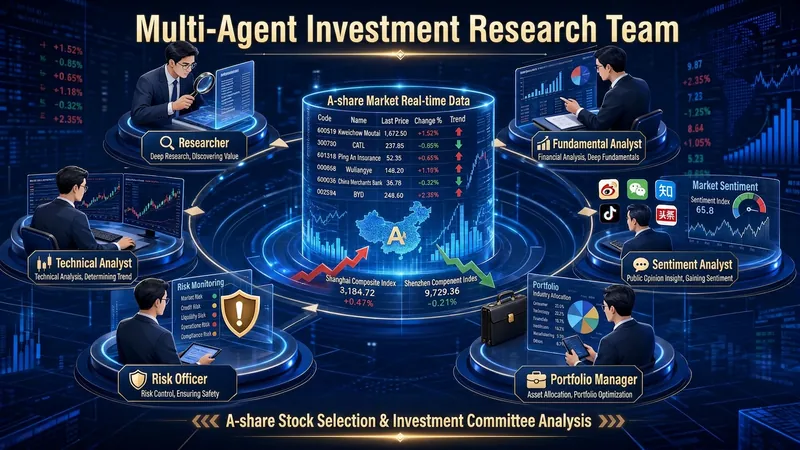 Research
Multi-Agent: A-Share Pick & IC
It's not an AI assistant, but a virtual investment research team. Common AI stock-picking tools suffer from three problems: fabricating financial figures and target prices, giving vague "bullish/bearish" remarks, and offering "buy" recommendations without clear reasoning. The Multi-Agent Investment Research Team tackles these with a three-pronged approach: 6 parallel roles, cross-validation, and mandatory source attribution. It convenes researchers, fundamental analysts, technical analysts, sentiment analysts, risk officers, and investment managers to work in parallel, deliberating like a real investment committee. What you get is not fuzzy opinions, but a professional research document with facts, signals, disagreements, risks, and every number traceable to its source. Two modes covering "researching a single stock" and "screening a batch of stocks" Mode A: Single-Stock Committee Deep Analysis — Just provide a stock (e.g., "Analyze BYD 002594"), and the skill automatically convenes a full investment committee: the researcher aggregates market data, financial reports, research reports, and industry chain positioning, presenting only objective facts; the fundamental analyst issues a financial health scorecard, key changes in the three financial statements, and PEG valuation; the technical analyst evaluates trends, moving averages, MACD, support and resistance levels, and provides a five-point buy signal hit table; the sentiment analyst scans institutional divergence, retail investor sentiment, and potential misinterpretations; the risk officer digs up counter-evidence, systematically refuting optimistic conclusions from other roles; finally, the investment manager, without adding new data, integrates everything to produce committee minutes and a one-page summary. Mode B: Multi-Condition Stock Screening — From a specified universe (e.g., CSI 300, a sector/theme basket, or your own stock pool), apply a three-layer funnel: L1 financial hard screen (three consecutive quarters of growth, ample cash flow, PEG<1 or huge increase in contract liabilities), L2 technical timing (base breakout, moving average golden cross, volume breakout, strong pullback on low volume, MACD crossing above zero line), L3 information validation (research report ratings and industry chain logic, eliminating "pure technical without fundamental basis" picks). After obtaining a candidate list, the top N stocks can automatically proceed to Mode A for deep analysis. What you will get Mode A delivers a fixed "five-piece set": ① Full analysis report integrating all six roles; ② Data source and evidence table, with each key conclusion mapped to "data → source → date"; ③ Meeting-style committee minutes (agenda → each role's view → disagreements → consensus → variables to track); ④ Risk list sorted by high/medium/low severity; ⑤ One-page investment manager summary condensing core logic, key variables, verification points, and confidence level. Mode B delivers: Candidate stock list table (ticker | name | triggered conditions | key data | source | trigger date) plus screening criteria and methodology description, optionally with the full five-piece set for top candidates. All outputs are saved as files with ticker and date in the filename for easy reuse and archiving.
Market Season Indicator
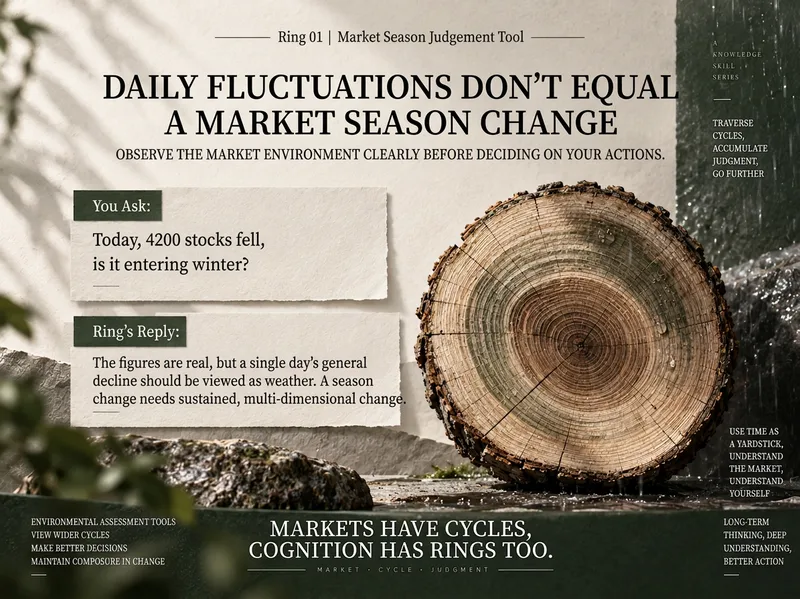
Investment judgments go wrong not because you misread a single news story, but because you failed to first identify the environment you are in. The same decline may be mere volatility at the end of summer, but signal accumulating risk at the start of fall. The same positive news can also mean completely different things at different stages. This Skill does not try to predict whether prices will rise or fall tomorrow. Instead, it first answers a more fundamental question: What kind of market environment are we in now? It considers: Valuation levels Sentiment and crowding Policy direction Market behavior The economic backdrop Structural differences between sectors and the broader market It then determines: Which season the market most closely resembles Whether it is in a transition zone between seasons Which evidence supports the assessment Which pieces of evidence conflict Whether recent changes are merely “weather” or significant enough to warrant a reassessment What future developments could invalidate the current assessment It does not reduce the four seasons to a mechanical score, or give falsely precise answers such as “an 82% probability of entering fall.” More importantly, it allows: The broader market and individual sectors to be in different seasons. The overall A-share market may still be at the end of summer, while a highly crowded growth sector already shows signs of fall. Meanwhile, another sector that has been depressed for a long time may just be beginning to thaw at the end of winter. Four typical use cases What season are we in right now? Is the overall A-share market closer to spring, summer, fall, or winter? xiaoxiaodong uses the latest verifiable evidence to assess the environment rather than looking only at today’s price movement. Is today’s sharp drop just weather? More than 4,000 stocks fell today. Does that mean we have entered winter? xiaoxiaodong first determines whether this is a one-day shock, then examines whether the medium-term trend, policy, valuation, and sentiment have also changed persistently. Why can the broader market and sectors be in different seasons? What seasons are the A-share market, AI/compute, and consumer sectors in? xiaoxiaodong assesses them separately instead of copying the broader-market conclusion directly to every sector. Can a single policy announcement really change the market season? Does the central bank’s latest policy mean the market has entered spring again? xiaoxiaodong distinguishes between a one-time event and an ongoing policy direction, and assesses whether the impact is on short-term sentiment or medium-term fundamentals. Example prompts Which season—spring, summer, fall, or winter—is the overall A-share market in right now? Assess the current seasons of the A-share market, AI/compute, and consumer sectors separately. More than 4,000 stocks fell today. Is this just weather, or has the market changed seasons? Trading volume has continued to shrink recently while the indexes remain near their highs. Does this look more like the end of summer or the start of fall? Could the central bank’s latest policy change the current market season? Why are the indexes still rising while most stocks have become harder to profit from? What it does not do: Precisely predict market tops and bottoms; Give a specific date for a seasonal transition or a falsely precise probability; Provide individual stock price targets or precise buy and sell points; Recommend personalized portfolio allocation percentages; Force a seasonal conclusion when the evidence is insufficient. It is a market-environment assessment tool, not a market-timing prediction tool.
 Research
A-share, HK & US Stock Quotes
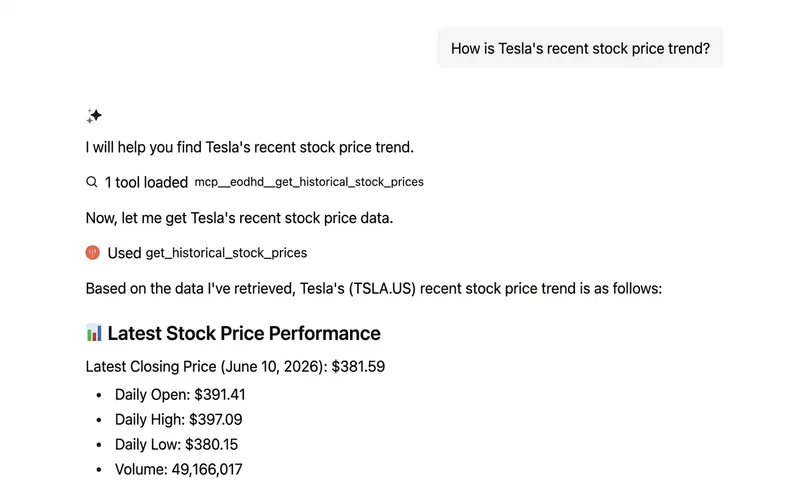
Whether you follow China's A-shares, Hong Kong H-shares, or US-listed stocks, this tool provides real-time and historical market data. You can easily look up a stock's latest price, percentage change, historical trends, dividends, stock splits, and other corporate actions, so you can stay fully informed about your investments. Beyond individual stock analysis, this tool also offers rich macroeconomic data, including US Treasury yields and commodity prices, to help you assess market sentiment and sector rotation. By aggregating company news and market sentiment analysis — especially for US stocks — you can gain deeper insight into what drives the market. For A-shares and Hong Kong stocks, you can also analyze keywords and related stocks in the news to spot industry trends and capital flows. This tool supports batch quote lookups for multiple stocks and can compare the premium or discount of Chinese concept stocks and Hong Kong stocks in the US ADR market, providing valuable context for cross-market investing. Whether you are monitoring the market regularly or quickly investigating unusual price movements, it serves as an efficient investment assistant. Please note that this tool provides data query services only and does not execute trades.
Information
- Version
- v3
- Last updated
- Runtime credits
- Usage-based
- Models
- Auto
