Knowledge Visual Guide
Visualize complex knowledge clearly
Knowledge Visual Guide
Visualize complex knowledge clearly
Showcase
Description
Breaks knowledge explanations into clear visual beats, matches compositions from a library of 350 layout patterns, and outputs image prompts ready for use in knowledge guides, knowledge cards, infographics, and stills for educational explainer videos.
Related Skills
View all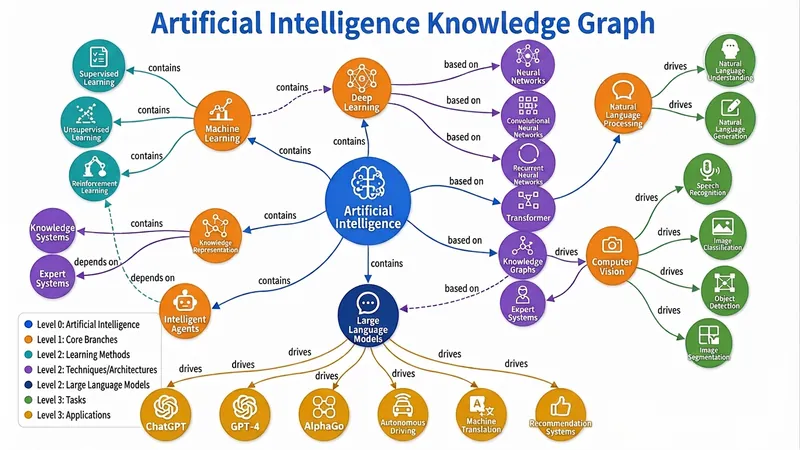
Knowledge Graph Engine
Automatically build five types of diagrams (Knowledge Graph, Mind Map, Concept Map, Flowchart/Architecture Diagram, Relation Diagram) from text, files, or topics, and output an interactive web page, static image, and visualization code all in one — a triple-threat solution built to the highest standards. Combines best practices from knowledge graph engineering and information visualization, supporting dynamic granularity control, disambiguation and deduplication, and multi-source cross-validation. Turn your words, files, or even a thought into a draggable, zoomable, searchable interactive knowledge graph in seconds, and export high-definition images and ready-to-use code with one click — this is the knowledge visualization "triple-threat" engine you've never experienced before. 🧠 What is the Knowledge Graph Engine? It's not the simple drawing tool you've seen before. It's a knowledge engineer + visualization expert hidden in your browser. Give it a textbook passage, a thesis, a PDF, or just a keyword, and it will automatically: 🔍 Extract core entities and clarify deep relationships 🧱 Build structured graph JSON (Knowledge Graph / Mind Map / Concept Map / Flowchart / Relation Diagram) 🎨 Output three top-tier forms: interactive web page + high-definition static image + Markdown/Mermaid/Graphviz code From now on, information organization doesn't rely on manual box drawing, and knowledge presentation is no longer just a static picture. ⚡ Why is it "top-tier"? 1. Fully automatic "text-to-graph" pipeline: No need to learn any modeling language or manually define nodes and connections. Just input content, and the engine automatically determines the graph type: Subject knowledge system? → Generates a semantically rich knowledge graph Reading notes deconstruction? → Generates a clear hierarchical mind map Process and decision? → Generates a flowchart/architecture diagram with branches Character relationship network? → Generates a multi-dimensional relation diagram Even if you just throw a topic word, it can independently gather information, fill in the content, and then generate the graph. 2. Triple-threat output covering all use cases: 🖱️ Interactive D3.js web page: Drag nodes, scroll to zoom, click for details, highlight related paths, keyword search... like operating a living map. Single-file HTML, no backend, can be embedded directly into any page or sent to anyone. 🖼️ High-definition static graph: Force-directed layout, color-coded categories, directly usable for thesis illustrations, PPT presentations, teaching materials — every label is sharp and readable. 📜 Visualization code: Generates both Mermaid and Graphviz source code simultaneously. Developers can directly insert into documentation, wiki, Notion, with unlimited expandability for secondary editing. 3. Ultimate user experience design: 🎨 Colors automatically mapped by entity type, hierarchy expressed intuitively by node size 🔗 Relationship labels displayed directly on curves — instantly see 'contains', 'causes', 'supports' 💡 Click any node, non-related parts auto-fade to focus on the thought path 🔄 Reset layout, search positioning, zoom and pan... all operations smooth as silk 4. Engineering wisdom balancing 'breadth' and 'depth': From entity disambiguation and deduplication to multi-source cross-validation; from hierarchical granularity control to dotted-line connections supporting cross-domain relationships — behind this are the best practices of knowledge graph engineering, not a toy but a productivity tool. 👥 Who needs it most? Teachers & Educational Content Creators: Turn entire textbook chapters into an interactive knowledge map — students click to understand concept relationships. Researchers & Students: Literature reviews no longer rely on text walls — one diagram clarifies the theoretical threads of dozens of papers. Product Managers & Enterprise Architects: System architecture, business processes, feature breakdown — instantly generate architecture diagrams, doubling communication efficiency. Readers & Lifelong Learners: Notes are no longer just outlines but explorable thought networks, letting knowledge truly 'grow' together. 🚀 Now, let your knowledge 'come alive' You give content, it gives insights. You give a topic, it gives a system. You give a requirement, it gives a complete deliverable of web pages, images, and code. This is not a feature; it's a workflow that elevates information into cognition. Let the Knowledge Graph Engine become an extension of your thinking, visualize your expertise, and reach every audience's 'aha moment.' — From today, don't 'draw' graphs, 'generate' graphs.
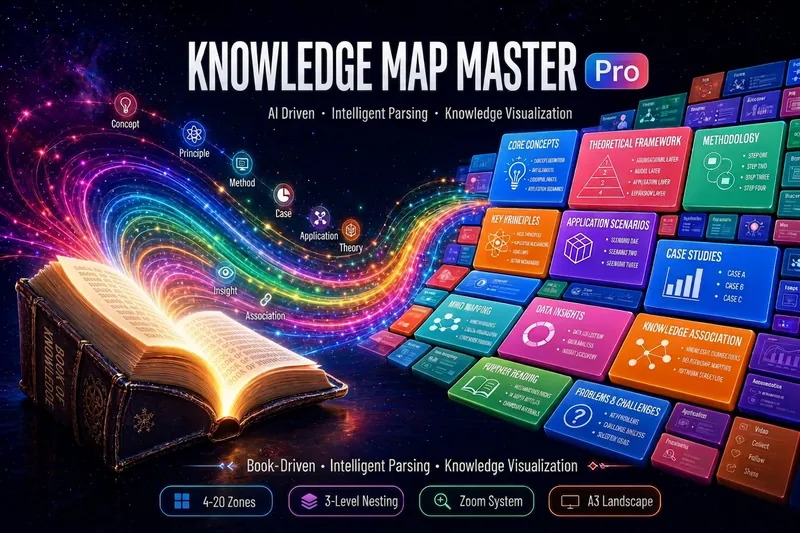
Knowledge Map Master Pro
Upload a book, a PPT, a paper, or any material → AI automatically breaks it down into a three-level nested knowledge structure → assembles it into a high-density A3 knowledge map. Bento tile layout: different topic areas vary in size, fitting together like puzzle pieces to fill the canvas seamlessly — key areas are larger and more detailed, while peripheral content is compact and refined. Supports 4-20 major zones, 80-600+ information nodes, 4 visual styles (professional poster, hand-drawn notes, vintage map, dark tech), and horizontal/vertical orientation. Built-in zoom and pan interaction, ready to print or export as PDF. One map to see the shape of all knowledge.
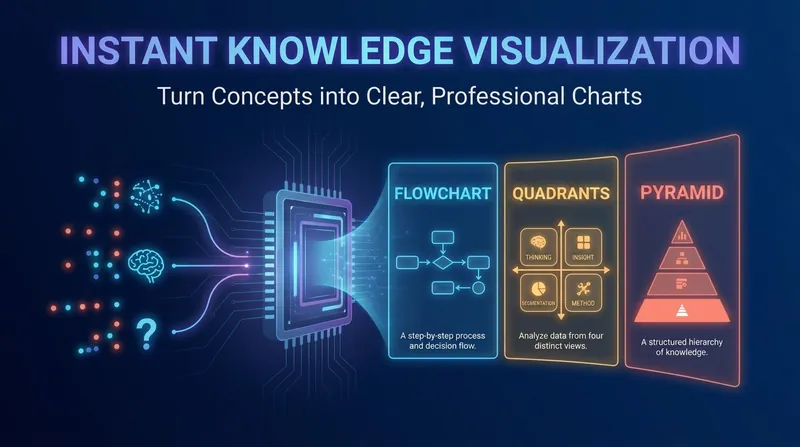
Knowledge Model Visualization
Transform knowledge frameworks/theoretical models into high-quality visual images. Users input model name, structure type, and Chinese labels, and the Skill automatically identifies the chart type, constructs professional prompts, and directly generates model card images, solving pain points for knowledge bloggers in Chinese character rendering and knowledge density expression.
Information
- Version
- v2
- Last updated
- Runtime credits
- Usage-based
- Models
- Auto
