
Buffett's 73-Check Assistant
AI scoring, autosave, history, rpt, prescore
Buffett's 73-Check Assistant
AI scoring, autosave, history, rpt, prescore
Showcase
Description
Buffett's decision assistant for companies and stocks. Supports opening the 73-item checklist, AI online pre-scoring (automatically searches data such as financial reports, valuations, competition, and scores each item), auto-saves analysis records, queries history, and generates reports. Deeply integrated with the web version of the "Value Investment Decision Elf Assistant".
Recommended by
淡苍
Why we love this skill
This skill turns Buffett's 73-item investment checklist into an AI tool that can automatically pre-score online, save analysis records, and generate reports. It is not only a decision assistant but also a smart steward of your investment knowledge base.
Related Skills
View all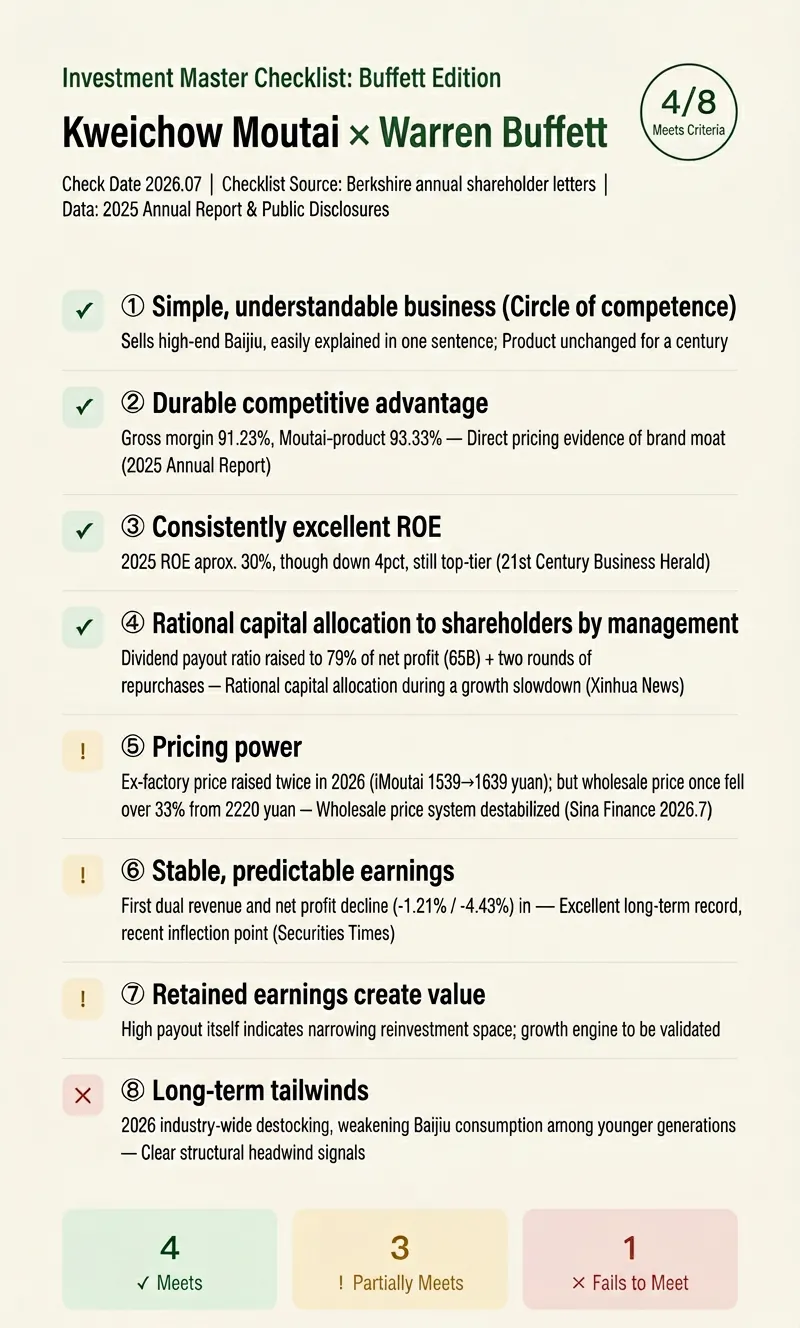
Guru Checklist: Buffett's View
Buffett's shareholder letters, Poor Charlie's Almanack, The Intelligent Investor—the standards of investment masters are public, but no one has ever helped you check them item by item. Enter a company (A-share/H-share/US stock), select a master's perspective: Buffett (default), Munger, Peter Lynch, Fisher, Graham. It will check online for public evidence corresponding to each standard, giving item-by-item judgments: ✅ Meets / ⚠️ Partially meets / ❌ Does not meet / ❓ Insufficient information, and generate a shareable scorecard long image (3:5 vertical, suitable for Xiaohongshu/WeChat Moments). Each delivery: ① Detailed check text: each standard with judgment, evidence, source and timestamp, plus "translation into plain English"—what this standard is really asking ② Scorecard summary (N/8 items met) + three most noteworthy points ③ A scorecard long image in classic value investing colors, ready to post Three golden rules: · Judgment must be backed by evidence; mark ❓ if not found, never fabricate data · Checklist items are faithful to the masters' published works, no fabricated "master standards" · Only present comparison results, do not represent the master's views, and do not constitute investment advice Repeat play: For the same company, check with all five masters, five perspectives cross-validate each other. Suitable for value investing learners, financial content creators, and ordinary investors who want to systematically understand a company.
Stock Report Analyzer
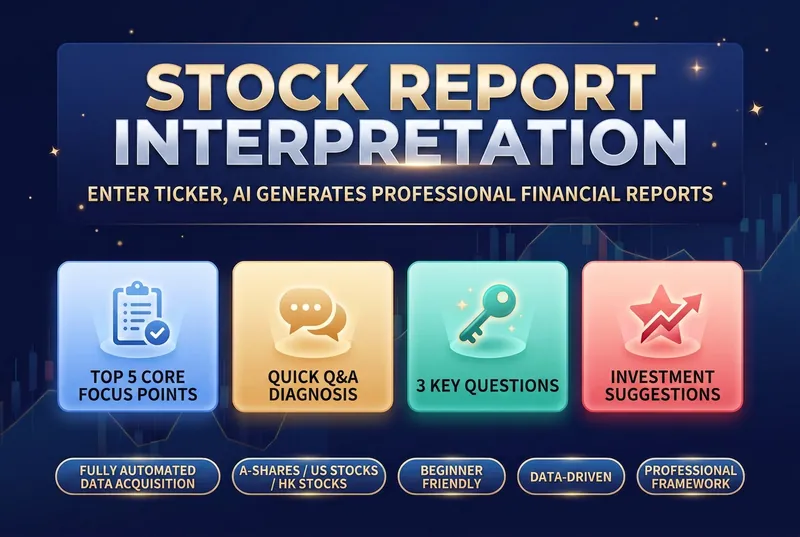
Financial reports are a listed company's "physical exam report", but most investors feel lost when faced with pages of dense numbers: • 📝 Can't read the three financial statements — What do the balance sheet, income statement, and cash flow statement tell you? Which numbers matter most? • 🤔 Don't know what to look at — With dozens of pages, which key metrics should you focus on? • 📊 Lack an analysis framework — Even when you find the data, how do you judge good from bad and cross-check it? • 🏭 Industry standards differ — What counts as "good" varies completely by industry; manufacturing and internet companies can't be measured with the same yardstick. • ⏰ Time cost is too high — Manually looking up data, comparing peers, and calculating growth rates can take hours for one report. This skill was built to solve exactly these problems. It automates a professional financial analyst's framework, so you just need to enter a stock code to get a structured, logical, and beginner-friendly financial report interpretation. The tool's core value lies in its rigorous analysis framework, covering multiple dimensions from assessing growth quality to analyzing business models. It not only compares core metrics like revenue, gross margin, net margin, and cash flow, but also runs a quick Q&A on the seven key financial questions investors care about most. It clearly shows whether profits are turning into real cash, and whether receivables and inventory carry potential risks. By benchmarking against industry leaders, it helps you identify a company's true position in its industry chain. When generating the report, it also evaluates valuation levels, core strengths, and potential risks, and offers data-driven recommendations on what to watch. All analysis is presented in intuitive tables and plain, easy-to-understand language, turning complex accounting terms into concrete investment logic. Whether for daily review or deep research, it helps you quickly zero in on the core issue amid massive amounts of data, improving the efficiency and accuracy of your investment decisions.
Dorsey Investment Analyzer V2
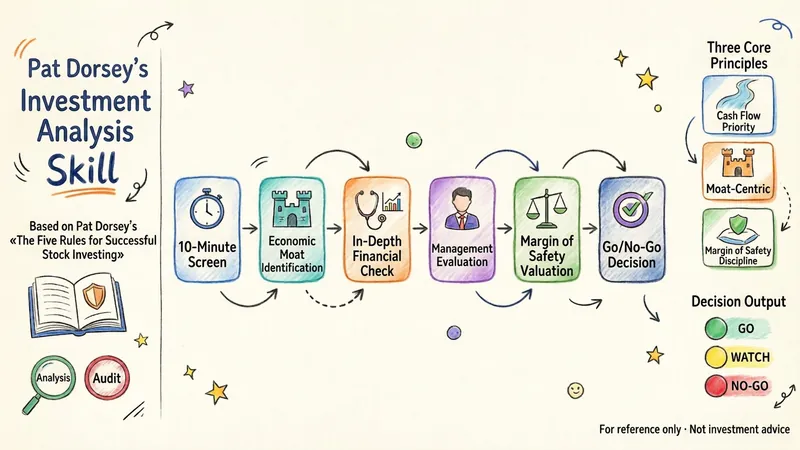
A structured investment analysis Skill based on Pat Dorsey's 'The Little Book That Builds Wealth' methodology. It provides users with Go/No-Go investment decision assistance through a six-phase workflow (Fast Screening → Moat → Financial Health Check → Management Assessment → Valuation → Decision). Core features: Cash Flow Priority, Moat Centricity, Margin of Safety Discipline, Dual-Core Adversarial Engine (Analysis Executor + Quality Auditor), Strict Step-by-Step Mechanism. Suitable for individual stock investment analysis, quick screening, complete investment report generation, and other scenarios.
Information
- Version
- v15
- Last updated
- Runtime credits
- Usage-based
- Models
- Auto
