Gold Trend Analysis Dashboard
Gold Trend Analysis Dashboard
Showcase
Description
Daily gold investment decision dashboard. Automatically collects the latest data from authoritative sources such as CME, WGC, and Reuters, providing macro trend analysis, capital flow tracking, risk warnings, and gold accumulation operation strategies (green/yellow/red light signals). Outputs a visual web dashboard containing key indicators such as gold price trends, premium rates, and US Treasury yields, helping investors make quick decisions.
Recommended by
nene@YouMind
Why we love this skill
This skill provides a Bloomberg terminal-style gold investment decision dashboard, ensuring accurate gold price information through multi-source data cross-validation. It not only integrates in-depth analysis across four dimensions—macroeconomics, capital flows, technicals, and geopolitics—but also intuitively provides actionable signals to help you precisely grasp gold market trends.
Related Skills
View all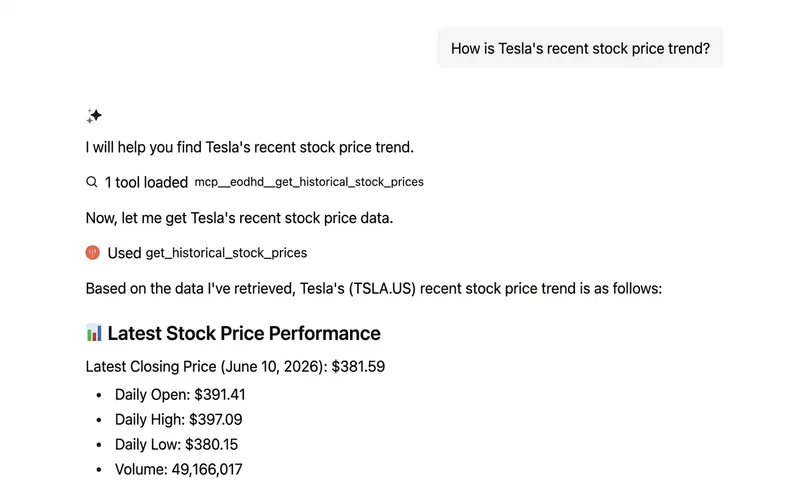 Research
A-share, HK & US Stock Quotes
Whether you follow China's A-shares, Hong Kong H-shares, or US-listed stocks, this tool provides real-time and historical market data. You can easily look up a stock's latest price, percentage change, historical trends, dividends, stock splits, and other corporate actions, so you can stay fully informed about your investments. Beyond individual stock analysis, this tool also offers rich macroeconomic data, including US Treasury yields and commodity prices, to help you assess market sentiment and sector rotation. By aggregating company news and market sentiment analysis — especially for US stocks — you can gain deeper insight into what drives the market. For A-shares and Hong Kong stocks, you can also analyze keywords and related stocks in the news to spot industry trends and capital flows. This tool supports batch quote lookups for multiple stocks and can compare the premium or discount of Chinese concept stocks and Hong Kong stocks in the US ADR market, providing valuable context for cross-market investing. Whether you are monitoring the market regularly or quickly investigating unusual price movements, it serves as an efficient investment assistant. Please note that this tool provides data query services only and does not execute trades.

CCTV News Stock Radar
Analyze each day’s News Broadcast to identify policy and industry signals worth noting for A-share investors. Assess the potential impact on the broader market, map affected sectors, and analyze positive and negative implications for specific stocks. The result is a polished, poster-style visual web report (not investment advice).
A-Share Market Thermometer
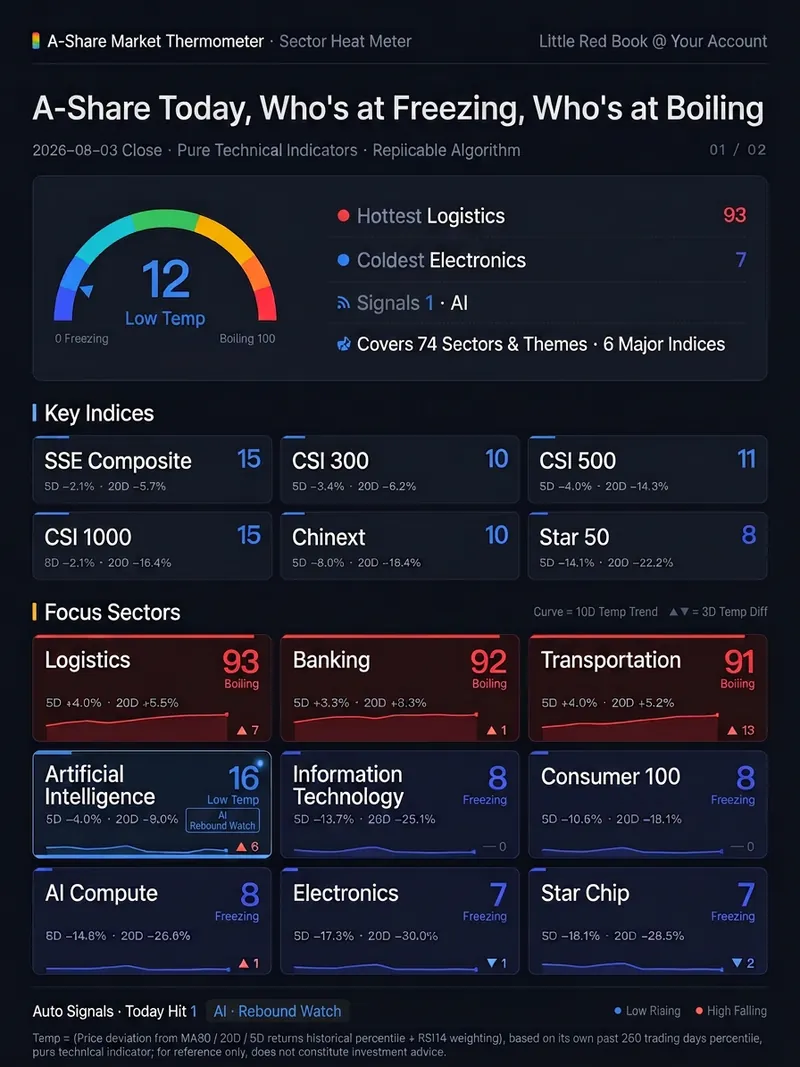
One command after the close delivers **a web page that does the calculation itself**: within 1–2 seconds of opening, it concurrently pulls 80 daily K-line data points in your own browser, scores the 6 major A-share indices plus 74 industries and themes on a 0–100 temperature scale, and renders the results as a two-page, 1080px-wide dashboard long image—ready to screenshot for Xiaohongshu or WeChat Official Account. Data goes through no intermediary and doesn't rely on an author-provided data source—your browser connects directly to the market data interface. So every time you open it, you get the latest live market data, not a static image that expires the next day. The temperature isn't “AI intuition”—it's a formula hard-coded in the page source. For the three factors—price deviation from MA60, 20-day returns, and 5-day returns—each one takes its own historical percentile over the past 250 trading days, and then RSI14 weighting is added. It uses percentiles rather than absolute gains/losses because banks may move 20% a year while theme sectors move 200%; only by converting to each one's historical position can they be compared on the same scale. Real example: on the same day, the finance & real estate and green power sectors had nearly identical 5-day and 20-day gains and sat right next to each other in the gain rankings. But their temperatures were 87 (high heat) and 50 (neutral)—because the former had risen above MA60 and hit its hottest level in a year, while the latter was just a small rebound after a deep drop. Seven qualitative levels: Ice Point / Low Temperature / Slightly Cool / Neutral / Warming / High Heat / Boiling Point. Automatic signals: temperature ≤20 and a rise of ≥5 degrees in the past 3 days = rebound watch; temperature ≥80 and a drop of ≥5 degrees in the past 3 days = pullback watch. Thresholds are hard-coded; if none are hit, it reports zero—it doesn't force a match. All 80 are publicly released CSI/CNI standard indices, with the code list hard-coded in the page. The algorithm is in the source code—you can inspect and reproduce it yourself. The same closing data always produces the same number no matter who runs it. It only measures temperature for indices and sectors, not individual stocks. It only presents hot/cold distributions and pattern signals; it does not recommend stocks, predict price movements, or constitute investment advice. Trigger words: market temperature / A-share thermometer / sector temperature / sector heat / market sentiment / sentiment indicator / is the market cold today / freezing point / boiling point / market overview / sector rotation / post-close review / temperature dashboard / market thermometer
Information
- Version
- v1
- Last updated
- Runtime credits
- Usage-based
- Models
- Auto
