
Value Investor Bayesian Updater
Bayesian probability updates for stock events
Value Investor Bayesian Updater
Bayesian probability updates for stock events
Showcase
Description
Using a Bayesian framework, it automatically fetches the latest events for the target stock, quantitatively updating bullish/bearish probabilities. The prior is determined by AI or historical state. Each event is evaluated with a seven-level likelihood ratio, and the posterior is calculated via a probability waterfall. It provides actionable recommendations and renders a bright white background visualization report.
Related Skills
View all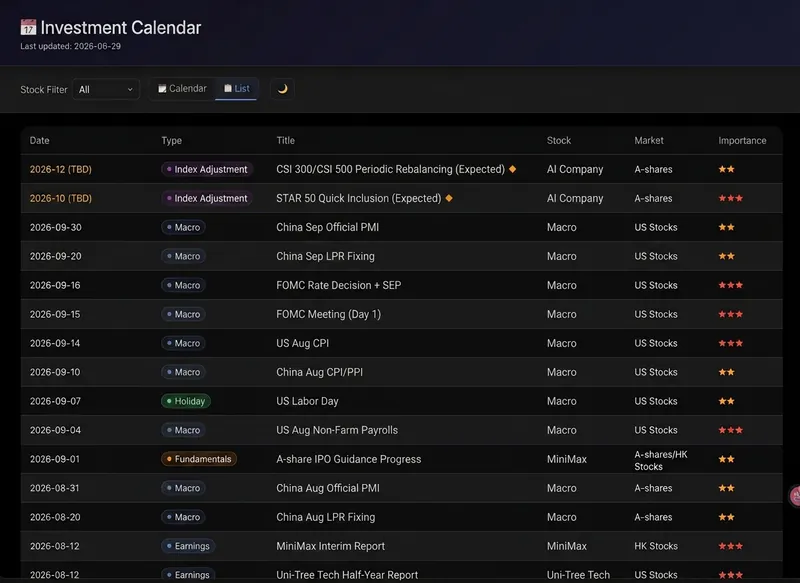
Value Investors Event Calendar
Automatically maintain a multi-stock event calendar for investors: 1. Fetch financial reports, dividends, lockup expirations, index adjustments, macroeconomic data, and holidays online, generating structured tables and an interactive HTML calendar. 2. Support three modes: view, refresh, and add/delete stocks, with incremental updates that do not overwrite history. 3. After the first generation, the HTML page reuses its structure; subsequent updates only modify the embedded event data JSON.
Stock Report Analyzer
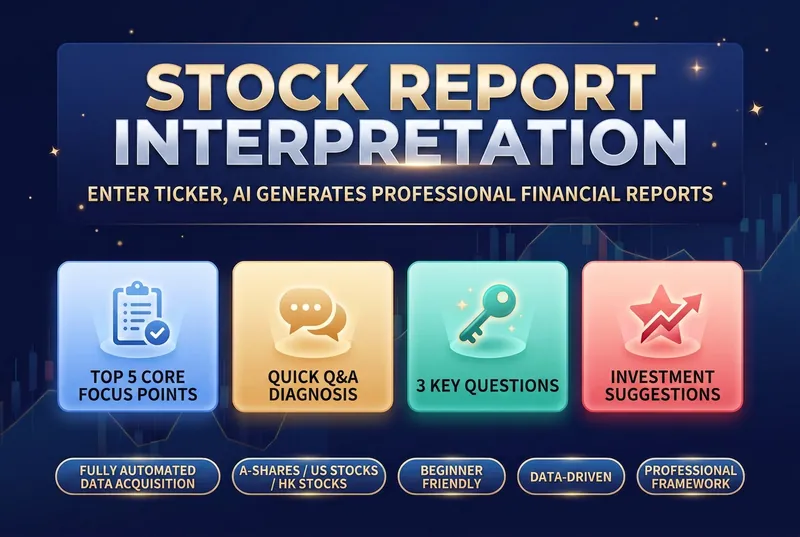
Financial reports are a listed company's "physical exam report", but most investors feel lost when faced with pages of dense numbers: • 📝 Can't read the three financial statements — What do the balance sheet, income statement, and cash flow statement tell you? Which numbers matter most? • 🤔 Don't know what to look at — With dozens of pages, which key metrics should you focus on? • 📊 Lack an analysis framework — Even when you find the data, how do you judge good from bad and cross-check it? • 🏭 Industry standards differ — What counts as "good" varies completely by industry; manufacturing and internet companies can't be measured with the same yardstick. • ⏰ Time cost is too high — Manually looking up data, comparing peers, and calculating growth rates can take hours for one report. This skill was built to solve exactly these problems. It automates a professional financial analyst's framework, so you just need to enter a stock code to get a structured, logical, and beginner-friendly financial report interpretation. The tool's core value lies in its rigorous analysis framework, covering multiple dimensions from assessing growth quality to analyzing business models. It not only compares core metrics like revenue, gross margin, net margin, and cash flow, but also runs a quick Q&A on the seven key financial questions investors care about most. It clearly shows whether profits are turning into real cash, and whether receivables and inventory carry potential risks. By benchmarking against industry leaders, it helps you identify a company's true position in its industry chain. When generating the report, it also evaluates valuation levels, core strengths, and potential risks, and offers data-driven recommendations on what to watch. All analysis is presented in intuitive tables and plain, easy-to-understand language, turning complex accounting terms into concrete investment logic. Whether for daily review or deep research, it helps you quickly zero in on the core issue amid massive amounts of data, improving the efficiency and accuracy of your investment decisions.

Munger Decision Master 2.0
An AI decision advisor integrating five-layer thinking penetration, Bayesian quantitative decision-making, and misjudgment psychology detection. Supports investment, business, and personal decision scenarios. Provides multi-round guided questioning, multi-decision comparison, decision review and history records, and supports exporting .md analysis reports.
Information
- Version
- v4
- Last updated
- Runtime credits
- Usage-based
- Models
- Auto
